
All in One View
Content from Introduction to WarpX
Last updated on 2026-09-23 | Edit this page
Estimated time: 10 minutes
Overview
Questions
- 🤌 What is WarpX?
- 🤔 What is a PIC code?
- 🧐 What can I use WarpX for?
- 🏋️ Why does it need HPC?
Objectives
- 💡 Understand the basics of PIC codes
- 🧑💻 Learn about the features of WarpX
- 🎯 Figure out if WarpX can be useful for you!
- 💰 Connect numerics to computational cost.
Overview of PIC
WarpX is a general purpose open-source high-performance multi-physics Particle-In-Cell (PIC) code. The PIC method is a very popular approach to simulate the dynamics of physical systems governed by relativistic electrodynamics. Plasmas ⭐ and beams ☄️, which are often made of charged particles that may travel almost at the speed of light, fall into this category. Additionally, other physical effects can be integrated into the PIC algorithm, such as different quantum 🎲 processes.
Here is a picture that condenses the core idea: there are particles and fields. The particles are approximated as macroparticles (usually each representative of many real particles), while the fields are approximated on a grid in space. The particles and the fields are updated, self-consistently, in a temporal loop.
🔎 What does one macroparticle represent? A macroparticle samples the positions and momenta of many physical particles. Its weight tells us how many particles it represents and therefore how much charge it contributes to the grid. For the same plasma density, we can use more macroparticles with smaller weights. This improves sampling and generally reduces statistical noise; it does not make the physical plasma denser.
Here is a more informative image that explains the core algorithmic steps. As the particles travel in space, they generate current densities, which in turn generate an electromagnetic field. The electromagnetic field then pushes the particles via the Lorentz force. Therefore, the current density \(\textbf{J}\) and the force \(\textbf{F}_L\) are the quantities that connect the particles and the fields, or in PIC lingo, the macroparticles and the grid. Hence, the idea is the following. First, define a well-posed initial condition, and then iterate the following:
- Interpolate the fields from the grid to the particles’ positions and compute the Lorentz force that acts on each macroparticle,
- Advance the position and momenta of the macroparticles using the relativistic equations of motion,
- Deposit the macroparticles’ current contributions onto the grid,
- Solve Maxwell’s equations.
In some cases, one can adopt an electrostatic approximation and solve Poisson’s equation instead of the full Maxwell equations. In that case, the current \(\textbf{J}\) calculation is replaced with the charge density \(\rho\) calculation. Once \(\rho\) is known, the electrostatic potential is computed to then find the electric field.
🔄 Self-consistent means feedback. A small excess of electrons in one region changes the electric field. That field changes electron motion, which changes the charge distribution and the field again. In the two-stream example, this feedback can amplify an initial disturbance into a growing wave. The evolving fields are part of the answer, rather than just a prescribed force on the particles.
If you want to know more about PIC, here are a few references:
- The two bibles on PIC 📚
- An old review written by one of the pioneers: John M. Dawson,
Particle simulation of plasmas, Rev. Mod. Phys. 55, 403
- Browse WarpX docs for many, many more references about advanced algorithms and methods.
What goes in, what comes out?
The input describes the geometry, particle species and their initial distributions, applied fields or lasers, and boundary conditions. It also sets the grid, time stepping, and which results to save. WarpX produces diagnostics: particle snapshots, fields on the grid, and reduced quantities such as total field energy. The log tells you how the run progressed; analysis notebooks turn the saved diagnostics into physical observations. The wakefield example walks through this input-to-plot workflow.
Features and applications of WarpX
WarpX is developed and used by a wide range of researchers working in different fields, from accelerator physics to nuclear fusion and a lot more. To learn about what WarpX can be used for, check out our examples and the scientific publications that acknowledged WarpX.
What physical questions can WarpX help answer?
WarpX can help investigate how charged particles and fields influence one another. For example:
- 🎢 Plasma instabilities: how can electrons moving through a plasma excite waves, and how do those waves change the particle motion? The two-stream example introduces this feedback.
- 🏎️ Plasma-based acceleration: how does a laser pulse or a particle beam drive a plasma wake, and which electrons gain energy from it?
- 🔦 Laser–matter interaction: how does an intense laser transfer energy to a target and accelerate ions? See the laser-driven ion accelerator.
- ☄️ Beam interactions: how do the fields of colliding particle beams change their trajectories? See the beam–beam example.
The WarpX application examples provide starting points for these studies. Each calculation still needs a choice of physical model, initial conditions, and numerical resolution appropriate to the system being studied.
Some cool features of WarpX:
📖 Open-source!
✈️ Runs on GPUs: NVIDIA, AMD, and Intel
🚀 Runs on multiple GPUs or CPUs, on systems ranging from laptops to supercomputers
🤓 Many many advanced algorithms and methods: mesh-refinement, embedded boundaries, electrostatic/electromagnetic/pseudospectral solvers, etc.
💾 Standards: openPMD for input/output data, PICMI for inputs
🤸 Active development and maintenance: check out our GitHub repo
🗺️ International, cross-disciplinary community: plasma physics, fusion devices, laser-plasma interactions, beam physics, plasma-based acceleration, astrophysics, others?
From PIC to HPC
The PIC loop explains where the computing work comes from: update many particles, transfer information between particles and the grid, and update fields on many cells. These operations repeat at every time step.
| Simulation choice | Connection to the physics | Connection to computing |
|---|---|---|
| Grid spacing | Determines which spatial structures can be resolved | Finer grids have more cells and require more memory |
| Time step | Determines which time scales can be resolved and must satisfy the chosen solver’s stability constraints, if any | Shorter steps require more computing time to cover the same physical duration |
| Macroparticles | Controls how densely the particle distribution is sampled and the noise | More particles require more work and memory |
| Saved diagnostics | Determine which changes can be inspected after the run | Writing and reading data take time and storage |
A simulation must resolve the characteristic spatial and time scales of interest. A three-dimensional grid can therefore become large, even though the physical experiment is small. More macroparticles improve sampling, but do not compensate for an inadequately resolved grid.
📏 Resolution is a choice to check. Grid spacing resolves spatial structures, time steps resolve their evolution, and particle count controls sampling noise. A successful run alone does not establish accuracy. Repeat with finer numerical settings and check whether the quantities you care about change appreciably. This is a convergence study: its purpose is to establish adequate resolution for your observable, rather than simply to make the calculation larger.
🏎️ High-performance computing (HPC) distributes this work across computing resources. A CPU has cores that can work concurrently; a GPU can carry out many similar particle or grid operations in parallel. On larger machines, work is also distributed across processes using MPI, a system for exchanging data between processes. Communication, uneven workloads, and writing diagnostics can limit the speedup. Using more hardware does not change which physics the input asks the code to solve. The WarpX parallelization settings describe how the grid is divided among processes and threads.
🧩 How is the work shared? WarpX divides the spatial grid into blocks. Processes can work on different blocks, while CPU threads or GPU threads update particles and fields within them. Neighboring blocks exchange field data, and particles crossing a block boundary must be passed to their new owner (we call it redistribution). If particles concentrate in one region, some processes may have more work than others and the simulation can be unbalanced. This is why both communication and balancing the workload matter when moving from one device to a large machine.
Content from Introduction to ImpactX
Last updated on 2026-09-23 | Edit this page
Estimated time: 10 minutes
Overview
Questions
- 🤌 What is ImpactX?
- 🤔 What is a beam dynamics code?
- 🧐 What can I use ImpactX for?
- 🏋️ Does it need HPC?
Objectives
- 💡 Understand the basics of beam dynamics codes
- 🧑💻 Learn about the features of ImpactX
- 🎯 Recognize applications of ImpactX and its relationship to WarpX.
- 💰 Connect numerics to computational cost.
Overview of beam dynamics
ImpactX is an open-source, high-performance beam dynamics code for particle accelerators. It follows beams through linear accelerators and rings, including collective effects from the particles’ own fields. Think of the input as a bunch of particles and an itinerary through magnets and accelerating cavities: ImpactX calculates how the bunch changes along that route. 🧲
A particle beam is a group of particles traveling in approximately the same direction. A short group within a beam is called a bunch. Magnetic fields 🧲 steer and focus beams; electric fields 🔋 can give particles energy. In a particle accelerator there are many elements that, in sequence, constitute the accelerator lattice. Each element has a specific function: for instance, radiofrequency cavities accelerate, dipoles steer the beams, quadrupoles focus the beams, etc. Each accelerator has its own complex lattice. Beam dynamics describes how the particles’ positions and momenta change as they travel through these components.
From a lattice to a simulation
In particle tracking, a collection of macroparticles samples the bunch’s positions and momenta. Each macroparticle represents part of the physical beam charge. Increasing their number can improve sampling without changing the total charge of the beam.
The ordered list of accelerator components is called a lattice. Some basic elements are:
| Element | Role in the beamline |
|---|---|
| Drift | A region without an applied focusing or bending field; particles continue along their directions of travel |
| Quadrupole magnet | Focuses in one transverse direction while defocusing in the other; combinations provide overall focusing |
| Dipole magnet | Bends the reference trajectory |
| Chicane (a sequence of magnets) | Sends the beam through a sideways detour and back to its original direction; energy-dependent path lengths can shorten or lengthen a bunch, depending on how energy varies along it |
| Solenoid magnet | Uses a magnetic field along the beam axis to focus the beam and couple horizontal and vertical motion |
| Steering kicker | Gives particles a transverse momentum change to adjust the beam’s direction |
| Accelerating cavity | Changes the particles’ energies |
| Buncher | Gives particles different energy changes according to their arrival time, allowing subsequent transport to shorten the bunch |
| Aperture / collimator | Defines an opening and removes particles that strike the modeled boundary |
| Beam monitor | Records simulated beam data at a chosen location |
The ImpactX element reference describes the available models and their settings. A lattice includes only the elements you specify; for example, particle losses at a collimator are modeled only when such an opening is included.
ImpactX advances particles along the reference trajectory, using distance s as the independent variable. At each element, a mathematical map updates their coordinates to represent passage through that component. Coordinates describe deviations from a reference particle, which follows the nominal accelerator trajectory. This is useful for measuring beam offsets and spreads. See the reference-trajectory explanation.
Here is the tracking recipe:
- Specify the reference particle and sample the incoming bunch.
- Define the lattice and its magnet or cavity settings.
- Advance the particles through successive elements, including any enabled collective effects.
- Record particle snapshots and quantities such as horizontal and vertical beam size along the beamline.
Space charge is the interaction of the bunch with its own electric field. When modeled with a PIC space-charge solver, particle charge is deposited on a grid, Poisson’s equation is solved, and the resulting field acts back on the particles. This adds grid work to particle tracking. ImpactX therefore is not limited to tracking independent particles in prescribed fields. See the ImpactX model overview.
If you want to know more about beam dynamics, here are a few references:
- 📚 Two books to explore:
- H. Wiedemann, Particle Accelerator Physics, 4th edition (2015). An open-access introduction to accelerators, beam transport, and focusing.
- M. Reiser, Theory and Design of Charged Particle Beams, 2nd edition (2008). A reference for beam physics, including space-charge effects.
- 🔬 A look at how the code is checked: C. E. Mitchell et al., ImpactX Modeling of Benchmark Tests for Space Charge Validation, HB2023.
- Browse the ImpactX theory documentation for the coordinate conventions and models behind the tracking.
Features and applications of ImpactX
ImpactX helps researchers study beam transport and explore accelerator settings. The code overview describes its scope; the examples below give a taste of what you can investigate.
What physical questions can ImpactX help answer?
Examples include:
- 🧲 Focusing and transport: how do magnet settings affect the beam’s size and shape along an accelerator?
- 🌈 Energy spread: how do particles of different energies respond to the same magnets, and how does this affect transport?
- 🎯 Alignment: how does a displaced magnet change the beam trajectory?
- 🏎️ Acceleration and compression: how do accelerating cavities change particle energies, and how can a beamline change a bunch’s length?
- 🤝 Collective effects: how do a bunch’s own electric fields change its size and distribution?
The ImpactX examples include focusing cells, alignment errors, accelerating cavities, chicanes, and beams with space charge. They provide starting points for choosing the components and effects needed for a particular study.
Some cool features of ImpactX:
📖 Open-source! Explore the code and development discussions.
🚀 Runs on CPUs and GPUs, from small examples to larger beam calculations.
🧲 Accelerator elements for focusing, bending, and acceleration, with models for collective effects such as space charge.
🐍 Python inputs to build a lattice, launch a run, and explore different settings.
💾 Beam diagnostics to follow particle distributions and beam sizes along the accelerator.
🔬 Benchmarks to check the models against known results: try the examples.
From beam tracking to high-performance computing
🏋️ The computing workload. Without collective effects, each particle can be advanced through a given element independently. This tracking is embarrassingly parallel : particles can be divided among CPU cores or GPUs with little coordination during their advance. More particles increase both tracking work and the amount of particle data that monitors can save.
🤝 Collective effects change the challenge. The particles now influence one another through the electromagnetic field, requiring more computational work and coordination. For space charge, ImpactX can use PIC to deposit particle charge on a grid, solve for the field, and apply it back to the particles, avoiding a direct calculation of every particle pair’s interaction. Large calculations need both computing resources and efficient field solvers, communication, and workload distribution.
WarpX and ImpactX in the same workflow 🔗
WarpX can resolve the evolving particles and fields in a laser–plasma accelerator. ImpactX can then model transport of a bunch through downstream accelerator components. These stages use different representations suited to the physics and scales being studied. Transferring a bunch requires consistent coordinates and a suitable beam selection.
- 🧲 ImpactX models how particle beams evolve through accelerator components.
- 🎯 The lattice, incoming bunch, and enabled effects define the physical model.
- 💰 Particle count, collective-field calculations, and diagnostics determine the workload.
Content from Install
Last updated on 2026-09-19 | Edit this page
Estimated time: 10 minutes
Overview
Questions
- 🔧 How can I install and run WarpX?
- 🕵️ How can I analyze the simulation results?
Objectives
- 💻 Install WarpX on your local machine either with Conda or from source
- 👀 Install the visualizations tools in
PythonandParaview
Basic dependencies
Just a heads-up before we dive deeper.
Via Conda-Forge
First, you need a Conda installation and we will
assume that you indeed have one.
If not, follow the instruction
at this link.
You can install Conda on most operative systems: Windows, macOS,
and Linux.
We will also assume you have some familiarity with the
terminal. Once you have Conda on your system,
WarpX is available as a package via Conda-Forge.
The installation is a one-liner 😌!
Ok, maybe two lines if you want to keep your system clean by creating a new environment.
The first warpx (after -n) is the name of
the conda environment; the second warpx is the name of the
package to be installed from the conda-forge channel.
Now you should have 4 different WarpX binaries in your
PATH called warpx.1d, warpx.2d,
warpx.3d, warpx.rz.
Each binary for a different dimensionality.
To check this, run:
If you get 3 different paths that look something like:
then you got this 🙌! You can also import pywarpx in
Python.
Conda’s WarpX is serial! To get a parallel WarpX version, install it from source.
From source
🎯 WarpX is easy to install via Conda:
conda -c conda-forge warpx
🔍 The documentation is the first place to look for answers, otherwise check out our issues and discussions and ask there.
Content from Set Up a Simulation from Scratch
Last updated on 2026-04-08 | Edit this page
Estimated time: 35 minutes
Overview
Questions
How do you go from “I want to simulate X” to a working WarpX input file?
Objectives
Navigate the WarpX repository to find relevant examples. Adapt an existing input file to your physics problem. Iterate on simulation parameters to observe the expected physics.
Introduction
Most simulations don’t start from a blank page. In practice, a physicist starting a new simulation will look for the closest existing example, adapt it to their problem, run it, look at the results, and iterate. This episode walks through that process step by step, using the two-stream instability as the target physics.
Rather than handing you a ready-made input file, we will start from a different example altogether – a uniform plasma – and modify it until we observe the instability. Along the way, we’ll make mistakes, debug them, and learn from the process.
This episode is complementary to the two-stream instability tutorial, which gives you a polished input file with exercises on parameter selection. Here we focus on the workflow: how to find, adapt, and iterate.
Step 1: What do we want to simulate?
Before touching any code, clarify the physics. We want to simulate the two-stream instability: two populations of electrons streaming through each other with opposite drift velocities, in a periodic box with a neutralizing background. The expected result is exponential growth of electrostatic perturbations and the formation of vortex structures (“cat eyes”) in phase space.
What do we need?
- A periodic box with a uniform plasma (electrons)
- Two counter-streaming populations with a relative drift velocity
- Diagnostics to look at the phase space \((z, u_z)\)
Step 2: Browse the WarpX examples
WarpX ships with many examples in its GitHub repository,
organized under Examples/Physics_applications/.
The documentation
also has a gallery
of examples with descriptions, input files, and analysis
scripts.
Find a starting point
Browse the examples in the WarpX repository or the documentation gallery. Which example is the closest to what we want?
The uniform_plasma
example is a good starting point: it already has a periodic box with a
uniform electron population, a Gaussian (thermal) momentum distribution,
and basic diagnostics. We “just” need to add a drift velocity and
duplicate the species.
Step 3: Start from the uniform plasma example
Here is the 2D uniform plasma input file, rendered directly from the WarpX repository:
OUTPUT
#################################
####### GENERAL PARAMETERS ######
#################################
max_step = 10
amr.n_cell =  128 128
amr.max_grid_size = 64
amr.blocking_factor = 32
amr.max_level = 0
geometry.dims = 2
geometry.prob_lo = -20.e-6   -20.e-6    # physical domain
geometry.prob_hi =  20.e-6    20.e-6

#################################
####### Boundary condition ######
#################################
boundary.field_lo = periodic periodic
boundary.field_hi = periodic periodic

#################################
############ NUMERICS ###########
#################################
warpx.serialize_initial_conditions = 1
warpx.verbose = 1
warpx.cfl = 1.0
warpx.use_filter = 0

# Order of particle shape factors
algo.particle_shape = 1

#################################
############ PLASMA #############
#################################
particles.species_names = electrons

electrons.charge = -q_e
electrons.mass = m_e
electrons.injection_style = "NUniformPerCell"
electrons.num_particles_per_cell_each_dim = 2 2
electrons.profile = constant
electrons.density = 1.e25  # number of electrons per m^3
electrons.momentum_distribution_type = "gaussian"
electrons.ux_th  = 0.01 # uth the std of the (unitless) momentum
electrons.uy_th  = 0.01 # uth the std of the (unitless) momentum
electrons.uz_th  = 0.01 # uth the std of the (unitless) momentum

# Diagnostics
diagnostics.diags_names = diag1
diag1.intervals = 10
diag1.diag_type = Full
This simulates a single electron species in a box with thermal fluctuations. No drift, no instability.
Step 4: Add a drift velocity
To create two counter-streaming beams, we need to:
-
Duplicate the species: create
ele1andele2with opposite drift velocities - Add a bulk drift to each species along one direction
Here are the key modifications. Replace the single
electrons species block with two species:
particles.species_names = ele1 ele2

ele1.species_type = electron
ele1.injection_style = "NUniformPerCell"
ele1.num_particles_per_cell_each_dim = 2 2
ele1.profile = constant
ele1.density = 1.e25
ele1.momentum_distribution_type = "gaussian"
ele1.ux_th = 0.01
ele1.uy_th = 0.01
ele1.uz_th = 0.01
ele1.uz_m = 0.1

ele2.species_type = electron
ele2.injection_style = "NUniformPerCell"
ele2.num_particles_per_cell_each_dim = 2 2
ele2.profile = constant
ele2.density = 1.e25
ele2.momentum_distribution_type = "gaussian"
ele2.ux_th = 0.01
ele2.uy_th = 0.01
ele2.uz_th = 0.01
ele2.uz_m = -0.1
The parameter uz_m sets the mean of the Gaussian
distribution for the \(z\)-momentum (in
units of \(m c\)), so +0.1
and -0.1 give two beams drifting in opposite directions at
\(\beta_0 \approx 0.1\).
What parameters do we need to check?
Before running, take a look at the rest of the input file. Are there any parameters that might need adjusting for the two-stream case?
A few things to keep in mind:
-
max_step = 10: way too few timesteps to see anything happen - Resolution: 128 cells may or may not be enough depending on the plasma parameters
-
Diagnostics: the uniform plasma example uses the
default
plotfileformat, but we’ll want to switch to openPMD so we can use openPMD-viewer to grab particle data easily
We’ll deal with these one at a time.
Define nt as a constant
A practical tip: define the number of timesteps as a
my_constants variable at the top of the input file, so you
can change it in one place and have everything else follow:
my_constants.nt = 10

max_step = nt
This is especially handy because you’ll also want the diagnostic interval to scale with the total number of steps (see below).
Switch diagnostics to openPMD
The uniform plasma example writes diagnostics in WarpX’s native
plotfile format. This works, but it’s much more convenient
to use the openPMD standard
instead, because then you can use the openPMD-viewer Python
library to grab particle and field data with a couple of lines of
code.
Replace the diagnostics block with:
diagnostics.diags_names = diag1
diag1.intervals = floor(nt/2)
diag1.diag_type = Full
diag1.fields_to_plot = none
diag1.format = openpmd
A few things to note:
-
diag1.intervals = floor(nt/2)writes 2 snapshots regardless of how many timesteps you run – so when you increasentlater, the diagnostic output adjusts automatically. -
diag1.fields_to_plot = noneskips the field data, since we only care about the particle phase space for now. -
diag1.format = openpmdenables the use of openPMD-viewer for analysis.
Step 5: Run – and nothing happens
Let’s run the simulation as-is with max_step = 10, just
to make sure the code doesn’t crash.
The simulation runs in a few seconds. Now open a Jupyter notebook and plot the phase space \((z, u_z)\) using openPMD-viewer:
PYTHON
from openpmd_viewer import OpenPMDTimeSeries
import matplotlib.pyplot as plt

ts = OpenPMDTimeSeries("./diags/diag1/")
z, uz = ts.get_particle(["z", "uz"], species="ele1", iteration=ts.iterations[-1])
plt.scatter(z, uz, s=0.1, alpha=0.3)
z, uz = ts.get_particle(["z", "uz"], species="ele2", iteration=ts.iterations[-1])
plt.scatter(z, uz, s=0.1, alpha=0.3)
plt.xlabel("z [m]")
plt.ylabel("uz [m_e c]")
plt.show()
The phase space looks like… two flat lines. Nothing is happening. That’s probably because we only ran 10 timesteps, and the instability needs time to grow from noise.
This is normal. Not seeing what you expect on the first try is part of the process. The important thing is to understand why and to iterate.
Step 6: Iterate
This is where the real work (and the learning) begins. Each iteration teaches you something about the physics and the numerics.
Increase the number of timesteps
If you defined my_constants.nt as suggested earlier,
just increase it: try my_constants.nt = 100 or
200 or more. Both max_step and the diagnostic
interval will update automatically.
Reduce the temperature
The instability is driven by the relative drift between the two beams. If the temperature is too high, the thermal spread dominates over the drift and the instability won’t develop. Try setting the thermal spread to zero:
ele1.ux_th = 0.0
ele1.uy_th = 0.0
ele1.uz_th = 0.0
This is a “cold beam” limit. In practice, some finite temperature is physical, but starting cold makes it easier to see the instability develop cleanly.
Switch to 1D
The two-stream instability is inherently a 1D phenomenon (along the drift direction). Running in 2D or 3D adds transverse dimensions that increase the computational cost without changing the essential physics. Change to 1D:
geometry.dims = 1
amr.n_cell = 256
geometry.prob_lo = -20.e-6
geometry.prob_hi = 20.e-6
Increase resolution and particles per cell
With only 2 particles per cell, the noise level is high. Try increasing to 100 or more. Also make sure the grid is fine enough to resolve the plasma skin depth \(c/\omega_{pe}\).
Put it all together
Combine all the modifications above into a single input file. Run the simulation and plot the phase space at multiple time snapshots. Do you see the instability developing?
You should see the two initially-flat streams begin to develop a
sinusoidal modulation, followed by the formation of vortex (“cat eye”)
structures as particles get trapped in the electrostatic potential
wells. The number of timesteps needed depends on the drift velocity and
density; you may need to adjust max_step until you see
saturation.
Step 7: Visualize the result
Once the instability is developing, you can produce a sequence of phase-space plots. Loop over the diagnostic snapshots:
PYTHON
from openpmd_viewer import OpenPMDTimeSeries
import matplotlib.pyplot as plt

ts = OpenPMDTimeSeries("./diags/diag1/")
for i in ts.iterations:
    z, uz = ts.get_particle(["z", "uz"], iteration=i)
    plt.figure()
    plt.scatter(z, uz, s=0.1, alpha=0.3)
    plt.xlabel("z [m]")
    plt.ylabel("uz [m_e c]")
    plt.title(f"iteration {i}")
    plt.savefig(f"phase_space_{i:06d}.png", dpi=150)
    plt.close()
From these frames you can make a video using ffmpeg:
What’s next?
Now that you’ve seen the full workflow – from browsing examples to iterating on parameters to producing visualizations – you can try the polished two-stream instability tutorial, which provides a carefully prepared input file with exercises on choosing physical and numerical parameters, reduced diagnostics for tracking the growth rate, and analysis notebooks.
The key takeaway is the process:
- Clarify the physics you want to simulate
- Find the closest existing example
- Modify it step by step
- Run, visualize, and iterate
- Don’t be discouraged when things don’t work on the first try
- Ask yourself: is what I’m seeing physics, numerics, or both? This is one of the hardest questions in computational physics…
The characteristic timescale of the two-stream instability is the
inverse plasma frequency \(\omega_{pe}^{-1}\), where \(\omega_{pe} = \sqrt{n_0 e^2 / (m_e
\epsilon_0)}\). The instability growth rate is of order \(\omega_{pe}\), so the simulation needs to
cover many plasma periods for the instability to develop and saturate.
This is why increasing nt is the first thing to try when
nothing seems to be happening.
The WarpX examples and the documentation gallery are the best starting points for a new simulation.
Setting up a simulation is an iterative process: run, visualize, understand what’s wrong, fix it, repeat.
When the simulation doesn’t show the expected physics, check the basics first: enough timesteps? resolved scales? adequate particles per cell? temperature not too high?
The documentation parameter reference is your constant companion for understanding and modifying input files.
Content from A Two-stream Instability
Last updated on 2026-04-08 | Edit this page
Estimated time: 30 minutes
Overview
Questions
🤼 How do two counter-streaming electron beams become unstable?
Objectives
Set up, run, and visualize a 1D two-stream instability simulation with WarpX. Understand how the choice of physical parameters affects the instability growth.
Introduction
The two-stream instability is one of the most fundamental kinetic instabilities in plasma physics. When two populations of charged particles (here, electrons) stream through each other with a relative drift velocity, small perturbations in the charge density can grow exponentially. The free energy stored in the relative drift is converted into electrostatic wave energy until the beams thermalize and the instability saturates.
This example uses a 1D periodic box with two counter-streaming electron populations on a neutralizing ion background.
Setup
Make sure to download the input file.
Whenever you need to prepare an input file, this is where you want to go.
OUTPUT
####################
### MY CONSTANTS ###
####################
# PLASMAS
my_constants.n0 = ... # [m^-3]
my_constants.T0 = ...*q_e # [J]
my_constants.v_te = sqrt(T0 / m_e) # [m/s]
my_constants.beta0 = ... # [-]
my_constants.omega_pe = sqrt(n0*q_e**2/(m_e*epsilon0)) # [1/s]
# BOX
my_constants.Lx = ...*clight/omega_pe
my_constants.nx = ...
my_constants.dx = Lx/nx
# TIME
my_constants.cfl = ...
my_constants.T = .../omega_pe
my_constants.dt = cfl * dx / clight
my_constants.nt = floor(T/dt)

##########################
### GENERAL PARAMETERS ###
##########################
stop_time = T
amr.n_cell = nx nx nx
amr.max_level = 0
geometry.dims = 1
geometry.prob_lo = -0.5*Lx -0.5*Lx  -0.5*Lx
geometry.prob_hi =  0.5*Lx  0.5*Lx   0.5*Lx

##########################
### BOUNDARY CONDITION ###
##########################
boundary.field_lo = periodic periodic periodic
boundary.field_hi = periodic periodic periodic
boundary.particle_lo = periodic periodic periodic
boundary.particle_hi = periodic periodic periodic

################
### NUMERICS ###
################
warpx.cfl = cfl
algo.maxwell_solver = yee
algo.particle_shape = 3
algo.particle_pusher = boris
warpx.use_filter = 1

#################
### PARTICLES ###
#################
particles.species_names = ele1 ele2

ele1.species_type = electron
ele1.injection_style = NRandomPerCell
ele1.num_particles_per_cell = 200
ele1.profile = constant
ele1.density = n0
ele1.momentum_distribution_type = maxwell_boltzmann
ele1.theta_distribution_type = constant
ele1.theta = T0 / (m_e * clight**2)
ele1.beta_distribution_type = parser
ele1.beta_function(x,y,z) = beta0
ele1.bulk_vel_dir = +z

ele2.species_type = electron
ele2.injection_style = NRandomPerCell
ele2.num_particles_per_cell = 200
ele2.profile = constant
ele2.density = n0
ele2.momentum_distribution_type = maxwell_boltzmann
ele2.theta_distribution_type = constant
ele2.theta = T0 / (m_e * clight**2)
ele2.beta_distribution_type = constant
ele2.beta = beta0
ele2.bulk_vel_dir = -z

###################
### DIAGNOSTICS ###
###################
# FULL
diagnostics.diags_names =  particles
particles.intervals = floor(nt/200)
particles.diag_type = Full
particles.species = ele1 ele2
particles.fields_to_plot = none
particles.format = openpmd
particles.openpmd_backend = bp
particles.dump_last_timestep = 1
particles.ele1.variables = w z uz
particles.ele2.variables = w z uz

# REDUCED
warpx.reduced_diags_names = FieldEnergy FieldMaximum
FieldEnergy.type = FieldEnergy
FieldEnergy.intervals = 1
FieldMaximum.type = FieldMaximum
FieldMaximum.intervals = 1
Choosing the parameters
You will notice that some parameters in the input file are set to
... (ellipsis). These are left for you to choose 🗳️!
Picking sensible physical and numerical parameters is an important part
of setting up a simulation. Here is some guidance.
Choose the physical parameters
The physical parameters you need to set are:
| Parameter | Symbol | Description |
|---|---|---|
n0 |
\(n_0\) | Electron density of each beam \([\mathrm{m^{-3}}]\) |
T0 |
\(T_0\) | Thermal temperature of each beam \([\mathrm{eV}]\) |
beta0 |
\(\beta_0 = v_d/c\) | Drift velocity of each beam normalized to \(c\) |
- A typical plasma prototype is an ionized gas. What is the number density of an ionized gas at standard conditions? Think of a fluorescent lamp, a tokamak, or the solar wind.
- The temperature should be low enough that the thermal spread does not wash out the instability: the drift velocity should be larger than the thermal velocity, i.e. \(v_d \gg v_{\mathrm{th}}\).
- The drift velocity \(\beta_0\) controls how fast the instability grows. Non-relativistic drifts (\(\beta_0 \ll 1\)) are a good starting point.
An ideal gas at standard temperature and pressure (\(T = 300\,\mathrm{K}\), \(p = 1\,\mathrm{atm}\)) has a number density \(n = p/(k_B T) \approx 2.5 \times 10^{25}\,\mathrm{m^{-3}}\). Typical plasma densities span many orders of magnitude depending on the degree of ionization and the environment:
| Example | Density \([\mathrm{m^{-3}}]\) |
|---|---|
| Solar wind | \(\sim 10^{6}\)–\(10^{7}\) |
| Fluorescent lamp | \(\sim 10^{17}\)–\(10^{18}\) |
| Tokamak core | \(\sim 10^{19}\)–\(10^{20}\) |
Any value in a sensible range will work for this exercise.
Choose the numerical parameters
The numerical parameters you need to set are:
| Parameter | Description |
|---|---|
Lx |
Box length, expressed in units of \(c/\omega_{pe}\) |
nx |
Number of grid cells |
cfl |
CFL number (must be \(< 1\)) |
T |
Total simulation time, expressed in units of \(\omega_{pe}^{-1}\) |
- The most unstable wavelength is \(\lambda \sim 2\pi\,\beta_0\,(c/\omega_{pe})\). The box must be large enough to fit several of these wavelengths.
- The grid must resolve the shortest relevant scale, i.e. \(\Delta x \lesssim c/\omega_{pe}\). So
nxshould be at least comparable toLx(in units of \(c/\omega_{pe}\)). - The CFL should be \(\lesssim 1\) for stability of the Yee solver.
- The simulation must run long enough for the instability to develop and saturate: \(\sim 50\)–\(200\,\omega_{pe}^{-1}\) is a typical range.
Notable details
Two electron species (
ele1,ele2) are initialized with equal densityn0and temperatureT0, but with opposite drift velocities \(\pm \beta_0 c\) along the \(z\)-axis.There is no ion background in this input. Because we do not ask WarpX to solve Poisson’s equation at initialization, the fields start at zero and the uniform charge density of the electrons never sources a DC field, effectively acting as if a neutralizing background were present.
The diagnostics write out particle data (
z,uz) for both species, which lets you construct the phase space \((z, u_z)\) at each snapshot.Reduced diagnostics (
FieldEnergy,FieldMaximum) record the total field energy and the maximum field value at every timestep, so you can track the exponential growth of the instability without post-processing the full data.
Run
Create a new folder and copy the input file there. Then fill it with your chosen parameters. This is a 1D simulation, so it should run very quickly even in serial.
You should see a standard output flashing out a lot of info.
At the end, you should find in your folder:
- a subfolder
diags/particles/with the full particle diagnostics
- files
FieldEnergy.txtandFieldMaximum.txtwith the reduced diagnostics, insidediags/reducedfiles/
- a file called
warpx_used_inputs: a summary of the inputs that were used to run the simulation
If that’s the case, yey! 💯
If the run went wrong, you may find a Backtrace.0.0 file
which can be useful for debugging purposes.
Visualize
With Python 🐍
Now that we have the results, we can analyze them using Python.
We will use the openPMD-viewer library
to grab the data that the simulation produced in openPMD format. Here you can find a
few tutorials on how to use the viewer. If you feel nerdy and/or you
need to deal with the data in parallel workflows, you can use the openPMD-api.
Here are some things you can visualize:
Phase space \((z, u_z)\): plot the particle positions and momenta at several time snapshots to see how the beams evolve from smooth streams into characteristic “cat-eye” vortices.
Field energy vs time: load
FieldEnergy.txtand plot the total electrostatic energy as a function of time on a semi-log scale. You should see an exponential growth phase followed by saturation.Growth rate: from the slope of \(\ln(E_{\mathrm{field}})\) during the linear phase, extract the growth rate and compare it to the theoretical prediction \(\gamma \sim \omega_{pe}\).
With a Jupyter notebook 📓
The notebook includes a phase-space plot \((z, u_z)\) and the evolution of the electric and magnetic field energy on a semi-log scale.
You can download the notebook and try it yourself. Remember to either run the notebook from the simulation directory or change the corresponding path in the notebook.
Questions for analysis
Describe what you observe in the phase space \((z, u_z)\) at different times and in the field energy evolution. Can you identify distinct stages?
How does the growth rate of the field energy depend on the drift velocity \(\beta_0\)? Try running with two different values and compare.
What happens to the phase space after saturation? Can you identify particle trapping in the electrostatic potential wells?
If you increase the temperature (decrease the ratio \(v_d / v_{\mathrm{th}}\)), does the instability still develop? At what point is it suppressed?
How does the number of particles per cell affect the noise level and the onset of the instability?
These are open-ended questions meant to guide your exploration. The key insight is that the instability requires \(v_d > v_{\mathrm{th}}\); when thermal effects dominate, Landau damping stabilizes the modes.
💡 The two-stream instability converts the kinetic energy of counter-streaming beams into electrostatic wave energy.
🔬 The instability growth rate depends on the ratio of drift velocity to thermal velocity: \(v_d / v_{\mathrm{th}} \gg 1\) is needed for the instability to develop.
📊 Reduced diagnostics (FieldEnergy,
FieldMaximum) let you track the instability growth in real
time without post-processing full datasets.
🔍 The documentation is the first place to look for answers, otherwise check out our issues and discussions and ask there.
📷 To analyze and visualize the simulation results in openPMD format, you can use the openPMD-viewer library for Python.
Content from A Weibel Instability
Last updated on 2026-09-19 | Edit this page
Estimated time: 30 minutes
Overview
Questions
How does a momentum anisotropy in a plasma generate magnetic fields from scratch?
Objectives
Set up, run, and visualize a 2D Weibel instability simulation with WarpX. Observe the spontaneous generation of magnetic fields from counter-streaming electron beams.
Introduction
The Weibel instability (also known as the current filamentation instability) is a fundamental electromagnetic instability that arises when there is an anisotropy in the momentum distribution of a plasma. Unlike the two-stream instability, which generates electrostatic waves, the Weibel instability generates magnetic fields.
The physical mechanism is as follows: when two electron populations stream past each other, any small magnetic perturbation will deflect the electrons, causing them to bunch into current filaments. These current filaments in turn amplify the magnetic field that caused the bunching, leading to exponential growth until the fields are strong enough to isotropize the distribution.
This instability plays a key role in astrophysical plasmas (e.g. collisionless shocks in gamma-ray bursts) and in laser-plasma interactions.
In this episode, we simulate it in 2D with two counter-streaming electron populations and periodic boundaries.
Setup
Make sure to download the input file.
Whenever you need to prepare an input file, this is where you want to go.
OUTPUT
####################
### MY CONSTANTS ###
####################
# PLASMAS
my_constants.n0 = ... # [m^-3]
my_constants.T0 = ...*q_e # [J]
my_constants.beta0 = ... # [-]
my_constants.omega_pe = sqrt(n0*q_e**2/(m_e*epsilon0)) # [1/s]
my_constants.skin_depth = clight / omega_pe # [m]
# BOX
my_constants.Lx = ...*skin_depth
my_constants.nx = ...
my_constants.dx = Lx/nx
# TIME
my_constants.cfl = ...
my_constants.T = .../omega_pe
my_constants.dt = cfl*dx/(sqrt(2)*clight)
my_constants.nt = floor(T/dt)

##########################
### GENERAL PARAMETERS ###
##########################
stop_time = T
amr.n_cell = nx nx nx
amr.max_level = 0
geometry.dims = 2
geometry.prob_lo = -0.5*Lx -0.5*Lx  -0.5*Lx
geometry.prob_hi =  0.5*Lx  0.5*Lx   0.5*Lx

##########################
### BOUNDARY CONDITION ###
##########################
boundary.field_lo = periodic periodic periodic
boundary.field_hi = periodic periodic periodic
boundary.particle_lo = periodic periodic periodic
boundary.particle_hi = periodic periodic periodic

################
### NUMERICS ###
################
warpx.cfl = cfl
algo.maxwell_solver = yee
algo.particle_shape = 3
algo.particle_pusher = boris
warpx.use_filter = 1

#################
### PARTICLES ###
#################
particles.species_names = ele1 ele2

ele1.species_type = electron
ele1.injection_style = NRandomPerCell
ele1.num_particles_per_cell = 80
ele1.profile = constant
ele1.density = n0
ele1.momentum_distribution_type = maxwell_boltzmann
ele1.theta_distribution_type = constant
ele1.theta = T0 / (m_e * clight**2)
ele1.beta_distribution_type = parser
ele1.beta_function(x,y,z) = beta0
ele1.bulk_vel_dir = +y

ele2.species_type = electron
ele2.injection_style = NRandomPerCell
ele2.num_particles_per_cell = 80
ele2.profile = constant
ele2.density = n0
ele2.momentum_distribution_type = maxwell_boltzmann
ele2.theta_distribution_type = constant
ele2.theta = T0 / (m_e * clight**2)
ele2.beta_distribution_type = constant
ele2.beta = beta0
ele2.bulk_vel_dir = -y

###################
### DIAGNOSTICS ###
###################
# FULL
diagnostics.diags_names =  fields
fields.intervals = floor(nt/200)
fields.diag_type = Full
fields.write_species = 0
fields.fields_to_plot = Bx Bz
fields.format = openpmd
fields.openpmd_backend = bp
fields.dump_last_timestep = 1
# REDUCED
warpx.reduced_diags_names = FieldEnergy FieldMaximum
FieldEnergy.type = FieldEnergy
FieldEnergy.intervals = 1
FieldMaximum.type = FieldMaximum
FieldMaximum.intervals = 1
Choosing the parameters
You will notice that some parameters in the input file are set to
... (ellipsis). These are left for you to
choose! Designing a good simulation requires making physical and
numerical choices –
this is part of the exercise.
Choose the physical parameters
The physical parameters you need to set are:
| Parameter | Symbol | Description |
|---|---|---|
n0 |
\(n_0\) | Electron density of each beam \([\mathrm{m^{-3}}]\) |
T0 |
\(T_0\) | Thermal temperature of each beam \([\mathrm{eV}]\) |
beta0 |
\(\beta_0 = v_d/c\) | Drift velocity of each beam normalized to \(c\) |
- The Weibel instability requires an anisotropy in the momentum space. Here, the anisotropy comes from the relative drift between the two beams. A mildly relativistic drift (e.g. \(\beta_0 \sim 0.1\)–\(0.5\)) will produce a clear instability.
- The temperature should be small enough that the thermal spread does not wash out the anisotropy. As a rule of thumb, \(v_d \gg v_{\mathrm{th}}\) where \(v_{\mathrm{th}} = \sqrt{T_0/m_e}\).
- A typical plasma prototype is an ionized gas. What is the number density of an ionized gas at standard conditions? Think of a fluorescent lamp, a tokamak, or the solar wind. What matters is that lengths and times are measured in units of \(c/\omega_{pe}\) and \(\omega_{pe}^{-1}\).
Choose the numerical parameters
The numerical parameters you need to set are:
| Parameter | Description |
|---|---|
Lx |
Box length (in each direction), expressed in units of \(c/\omega_{pe}\) |
nx |
Number of grid cells per direction |
cfl |
CFL number (must be \(< 1/\sqrt{2}\) in 2D for the Yee solver) |
T |
Total simulation time, expressed in units of \(\omega_{pe}^{-1}\) |
- The Weibel filaments have a characteristic size of a few \(c/\omega_{pe}\). The box should be large enough to contain several filaments.
- You need to resolve \(c/\omega_{pe}\) on the grid: \(\Delta x \lesssim c/\omega_{pe}\).
- In 2D, the Yee solver CFL condition is \(\mathrm{cfl} < 1/\sqrt{2} \approx 0.7\).
Note how the input file already accounts for this in the
dtformula. - The Weibel instability grows slower than the two-stream instability. You will need a longer simulation: \(\sim 100\)–\(500\,\omega_{pe}^{-1}\).
Notable details
The geometry is 2D (
geometry.dims = 2) with periodic boundary conditions in all directions.Two electron species (
ele1,ele2) are initialized with equal density and temperature but with opposite drift velocities along the \(y\)-axis.The diagnostics record the magnetic field components
BxandBzat regular intervals,
allowing you to visualize the growth of filamentary magnetic structures.Reduced diagnostics (
FieldEnergy,FieldMaximum) track the total field energy and the maximum field amplitude at every timestep. Since the system starts with essentially zero magnetic field (only numerical noise), you can directly observe the exponential growth of the Weibel instability in these quantities.
Run
Create a new folder and copy the input file there, after filling in your chosen parameters.
If you want to speed things up, you can run in parallel:
Depending on your choice of resolution and box size, this simulation
may take from a few minutes to much longer. If it takes too long, try
reducing nx or T.
You should see a standard output flashing out a lot of info.
At the end, you should find in your folder:
- a subfolder
diags/with the full field and particle diagnostics
- files
FieldEnergy.txtandFieldMaximum.txtwith the reduced diagnostics, insidediags/reducedfiles/
- a file called
warpx_used_inputs: a summary of the inputs that were used to run the simulation
If that’s the case, yey! 💯
If the run went wrong, you may find a Backtrace.0.0 file
which can be useful for debugging purposes. Let me know if the code
fails in any way!
Visualize
With Python 🐍
Now that we have the results, we can analyze them using Python.
We will use the openPMD-viewer library
to grab the data that the simulation produced in openPMD format. Here you can find a
few tutorials on how to use the viewer. If you feel nerdy and/or you
need to deal with the data in parallel workflows, you can use the openPMD-api.
Here are some things you can visualize:
Magnetic field maps: use
get_field('B', 'z')(or'x') to plot 2D maps of the magnetic field at different times. You should see the formation and growth of filamentary structures.Field energy vs time: load
FieldEnergy.txtand plot the total field energy on a semi-log scale as a function of time. You should see a clear exponential growth phase followed by saturation.Filament spacing: from the 2D field maps, estimate the characteristic spacing of the current filaments and compare it to the skin depth \(c/\omega_{pe}\).
With a Jupyter notebook 📓
The notebook includes a magnetic field map (\(B_x\)) and the evolution of the electric and magnetic field energy on a semi-log scale.
You can download the notebook and try it yourself. Remember to either run the notebook from the simulation directory or change the corresponding path in the notebook.
Questions for analysis
Describe what you observe in the magnetic field maps and in the field energy evolution. Can you identify distinct stages?
How does the magnetic field energy grow in time? Can you identify a linear (exponential) growth phase on a semi-log plot? Estimate the growth rate \(\gamma\) from the slope.
What is the characteristic size of the filaments at saturation? How does it compare to \(c/\omega_{pe}\)?
How does the growth rate depend on \(\beta_0\)? Try at least two different drift velocities and compare the field energy time histories.
What happens if you increase the temperature \(T_0\) while keeping \(\beta_0\) fixed? At what point does the instability shut off?
Compare this simulation to the two-stream instability episode. What are the key differences in the fields that are generated (electrostatic vs electromagnetic)?
These are open-ended questions meant to guide your exploration. The Weibel growth rate in the cold limit scales as \(\gamma \sim \omega_{pe}\,\beta_0\), and the characteristic filament size is of order the skin depth. Finite temperature tends to stabilize short-wavelength modes.
💡 The Weibel instability generates magnetic fields from a momentum anisotropy – unlike the two-stream instability, which generates electrostatic fields.
🔬 The instability produces current filaments with a characteristic size of order the plasma skin depth \(c/\omega_{pe}\).
📊 Reduced diagnostics (FieldEnergy,
FieldMaximum) are an efficient way to monitor the
instability growth without storing large field dumps.
⚡ Choosing parameters wisely (\(v_d \gg v_{\mathrm{th}}\), sufficient resolution and box size) is essential for observing the instability clearly.
🔍 The documentation is the first place to look for answers, otherwise check out our issues and discussions and ask there.
📷 To analyze and visualize the simulation results in openPMD format, you can use the openPMD-viewer library for Python.
Content from A Magnetic Mirror
Last updated on 2026-04-06 | Edit this page
Estimated time: 12 minutes
Overview
Questions
🪞 How to simulate the dynamics of charged particles in an external field?
Objectives
🏃 Run and 👀 visualize some protons in a magnetic mirror!
Setup
In this example we will simulate a bunch of protons inside a
magnetic mirror machine. The protons are initialized with
random positions and velocities. The magnetic field is loaded from a
.h5 file. Make sure to download the input file.
Whenever you need to prepare an input file, this is where you want to go. By the way, analytics tell us that this is the most popular page of the documentation 👠!
OUTPUT
##########################
# USER-DEFINED CONSTANTS #
##########################
my_constants.Lx = 2 # [m]
my_constants.Ly = 2 # [m]
my_constants.Lz = 5 # [m]
my_constants.dt = 4.4e-7 # [s]
my_constants.Np = 1000

############
# NUMERICS #
############
geometry.dims = 3
geometry.prob_hi =  0.5*Lx  0.5*Ly Lz
geometry.prob_lo = -0.5*Lx -0.5*Ly 0
amr.n_cell = 40 40 40
max_step = 500
warpx.const_dt = dt

##############
# ALGORITHMS #
##############
algo.particle_shape = 1
amr.max_level = 0
warpx.do_electrostatic = labframe
warpx.grid_type = collocated
warpx.serialize_initial_conditions = 0
warpx.use_filter = 0

##############
# BOUNDARIES #
##############
boundary.field_hi = pec pec pec
boundary.field_lo = pec pec pec
boundary.particle_hi = absorbing absorbing absorbing
boundary.particle_lo = absorbing absorbing absorbing

#############
# PARTICLES #
#############
particles.species_names = protons
protons.charge = q_e
protons.mass = m_p
protons.do_not_deposit = 1 # test particles
protons.initialize_self_fields = 0
protons.injection_style = gaussian_beam
protons.x_rms = 0.1*Lx
protons.y_rms = 0.1*Ly
protons.z_rms = 0.1*Lz
protons.x_m = 0.
protons.y_m = 0.
protons.z_m = 0.5*Lz
protons.npart = Np
protons.q_tot = q_e*Np
protons.momentum_distribution_type = uniform
protons.ux_min = -9.5e-05
protons.uy_min = -9.5e-05
protons.uz_min = -0.000134
protons.ux_max = 9.5e-05
protons.uy_max = 9.5e-05
protons.uz_max = 0.000134

##########
# FIELDS #
##########
# field here is applied on directly the particles!
particles.B_ext_particle_init_style = read_from_file
particles.read_fields_from_path = example-femm-3d.h5

###############
# DIAGNOSTICS #
###############
diagnostics.diags_names = diag1
diag1.diag_type = Full
diag1.fields_to_plot = Bx By Bz
diag1.format = openpmd
diag1.intervals = 1
diag1.proton.variables = ux uy uz w x y z
diag1.species = protons
diag1.write_species = 1
A few notable details:
The protons are test particles because of the parameter
protons.do_not_deposit=1. This means that the protons do not deposit their current density, therefore they do not contribute to the fields.The magnetic field is applied directly to the particles with the
particles.B_ext_particle_init_styleflag, so in principle the grid is not used at all. For technical reasons, we must define a grid nonetheless.
Now that we have an idea of what the input files looks like, let’s
set up our environment. Activate the warpx environment if
you need to. Create a new directory with your own copy of the input
file. Also, don’t forget to download the field file and place
it in the directory where you will run the input.
Run
Let’s run the code
How would you do it? 🤷
You should see a standard output flashing out a lot of info.
At the end, you should find in your folder:
- a subfolder called
diags: here is where the code stored the diagnostics
- a file called
warpx_used_inputs: this is a summary of the inputs that were used to run the simulation
If that’s the case, yey! 💯
If the run went wrong, you may find a Backtrace.0.0 file
which can be useful for debugging purposes. Let me know if the code
fails in any way!
Here we have loaded the field of hte magnetic bottle from a file. You can also you can define an external field analytically.
Visualize
With Python 🐍
Now that we have the results, we can analyze them using Python.
We will use the openPMD-viewer library
to grab the data that the simulation produced in openPMD
format. Here you can find a
few great tutorials on how to use the viewer. If you feel nerdy
and/or you need to deal with the data in parallel workflows, you can use
the openPMD-api.
As an example for the magnetic bottle simulation, we have developed simple Jupyter notebook where we retrieve the magnetic field and the particle attributes at the end of the simulation. With a little bit more work, we also plot the trajectories of the particles.
You can download the notebook and try it yourself. Remember to either run the notebook from the simulation directory or change the corresponding path in the notebook.
With Paraview
Now it’s time to produce some pretty cool images and videos! 😎 If
you don’t have it, you can download Paraview here. In
the diags/diag1 directory you should find a file named
paraview.pmd: Paraview can read .pmd files.
Just open Paraview and from there open the .pmd file. You
should see Meshes and Particles in your
pipeline browser (usually on the left). We can zhuzh up the pipeline so
that we can visualize the trajectories of the protons in time
This is the pipeline that I have used to produce the visualizations below.
If you make any other 3D visualization with this data, let me know! We can add it here 😉!
And that’s all for now! 👋
💡 The external B field is loaded from an openPMD file, while the protons are defined as test particles.
📷 To analyze and visualize the simulation results in openPMD format, you
can use the openPMD-viewer
library for Python or you can open .pmd files directly in
Paraview.
Content from A FODO Cell
Last updated on 2026-04-06 | Edit this page
Estimated time: 30 minutes
Overview
Questions
How to simulate a particle beam travelling through a FODO cell 🧲🛝🧲?
Objectives
Learn how to setup, run, and visualize a particle beam simulation through a FODO (Focusing-Defocusing) cell with WarpX 🎢
Setup
In this example we will simulate a particle beam travelling through a FODO cell. A FODO cell is a periodic focusing structure used in particle accelerators, consisting of alternating Focusing (F) and Defocusing (D) quadrupole magnets, with O (drift) sections in between. The FODO cell is one of the most fundamental building blocks in accelerator physics, providing transverse focusing to keep particle beams confined as they travel through the accelerator. The alternating focusing and defocusing quadrupoles create a net focusing effect in both transverse planes, allowing the beam to be transported over long distances while maintaining its size.
WarpX for Beam Dynamics
WarpX is a Particle-in-Cell (PIC) code that can track particles embedded in external fields. Two important features are:
Space charge effects: You can turn space charge effects on or off using the appropriate input parameters. When enabled, WarpX solves the electromagnetic (or electrostatic) fields self-consistently from the particle distributions, allowing you to study how the beam’s own fields affect its dynamics.
Arbitrary external fields: WarpX allows you to define arbitrary external electromagnetic fields, either analytically or by loading them from files. This makes it possible to model complex accelerator elements like quadrupoles, dipoles, and other magnets.
WarpX is not necessarily the best tool for all beam dynamics simulations. If space charge effects are negligible and you’re primarily interested in linear beam optics, there are more specialized and computationally efficient tools available, such as ImpactX.
WarpX vs ImpactX
ImpactX is another code from the same ecosystem, the Beam, Plasma & Accelerator Simulation Toolkit (BLAST), designed for beam dynamics. See the ImpactX documentation and repository. Key differences:
-
WarpX — t-based (time-based):
solves Maxwell/Poisson on a grid, advances particles and fields in time.
Best for:
- Strong space charge, wakefields, full EM solutions
- Plasma–beam and other collective effects
- When time evolution of fields matters
-
ImpactX — z-based
(position-based): tracks particles along the beamline through lattice
elements. Best for:
- Weak or approximated space charge
- Optics design, linear dynamics, envelope tracking
- Fast runs when detailed field evolution is not needed
For this tutorial we use WarpX to set up a FODO simulation with optional space charge.
Equivalent ImpactX Example
If you’re interested in seeing how a similar FODO cell simulation can be set up using ImpactX, check out the ImpactX FODO cell example with 2D space charge using envelope tracking. This example demonstrates the envelope tracking approach.
Whenever you need to prepare an input file, this is where you want to go.
OUTPUT
####################
### MY CONSTANTS ###
####################
# BEAM
my_constants.mass          = m_p                              # kg
my_constants.current       = 0.5                              # A
my_constants.energy        = 6.7e6 * q_e                      # J
my_constants.velocity      = sqrt(2 * energy / mass)          # m/s
my_constants.gamma         = energy / (mass * clight**2) + 1. # -
my_constants.beta          = velocity / clight                # -
my_constants.beta_x        = 0.737881                         # m
my_constants.beta_y        = 0.737881                         # m
my_constants.beta_t        = 0.25                             # m
my_constants.alpha_x       = +2.4685083                       # -
my_constants.alpha_y       = -2.4685083                       # -
my_constants.alpha_t       = 0.                               # -
my_constants.gamma_x       = (1+alpha_x**2)/beta_x            # m^-1
my_constants.gamma_y       = (1+alpha_y**2)/beta_y            # m^-1
my_constants.gamma_t       = (1+alpha_t**2)/beta_t            # m^-1
my_constants.emitt_x       = 1.0e-6                           # m
my_constants.emitt_y       = 1.0e-6                           # m
my_constants.emitt_t       = 1.0e-6                           # m
my_constants.sigma_x       = sqrt(emitt_x * beta_x)           # m
my_constants.sigma_y       = sqrt(emitt_y * beta_y)           # m
my_constants.sigma_z       = sqrt(emitt_t * beta_t)           # m
my_constants.sigma_ux      = beta * sqrt(emitt_x * gamma_x)   # -
my_constants.sigma_uy      = beta * sqrt(emitt_y * gamma_y)   # -
my_constants.sigma_uz      = beta * sqrt(emitt_t * gamma_t)   # -
my_constants.sigma_t       = sigma_z / velocity               # s
my_constants.charge        = current *sigma_t                 # C
# BOX
my_constants.Lx   = 20*sigma_x  # m
my_constants.Ly   = 20*sigma_y  # m
my_constants.zmin = -20*sigma_z # m
my_constants.zmax = 0
# LATTICE
my_constants.L_drift1      =  7.44e-2 # m
my_constants.L_drift2      = 14.88e-2 # m
my_constants.L_drift3      =  7.44e-2 # m
my_constants.quad_gradient = 38.64    # T/m
my_constants.L_quad        = 6.10e-2  # m
# TIME
my_constants.T = (L_drift1+L_drift2+L_drift3+2*L_quad)/velocity # s
my_constants.dt = sigma_t/4                                     # s
my_constants.nt = floor(T/dt)                                   # -

##########################
### GENERAL PARAMETERS ###
##########################
stop_time                = T
geometry.dims            = 3
geometry.prob_lo         = -0.5*Lx -0.5*Ly zmin
geometry.prob_hi         = +0.5*Lx +0.5*Ly zmax
amr.n_cell               = 64 64 128
amr.max_level            = 0
warpx.limit_verbose_step = 1
warpx.const_dt           = dt
warpx.do_electrostatic   = labframe
warpx.poisson_solver     = fft
warpx.do_moving_window   = 1
warpx.moving_window_dir  = z
warpx.moving_window_v    = beta  # in units of c
algo.particle_shape      = 3
boundary.field_lo        = open open open
boundary.field_hi        = open open open

#################
### PARTICLES ###
#################
particles.species_names         = beam
beam.species_type               = proton
beam.injection_style            = gaussian_beam
beam.x_rms                      = sigma_x
beam.y_rms                      = sigma_y
beam.z_rms                      = sigma_z
beam.x_m                        = 0
beam.y_m                        = 0
beam.z_m                        = 0.5*zmin
beam.npart                      = 1e3
beam.q_tot                      = charge
beam.momentum_distribution_type = gaussian
beam.uz_m                       = beta*gamma
beam.uy_m                       = 0.0
beam.ux_m                       = 0.0
beam.ux_th                      = sigma_ux
beam.uy_th                      = sigma_uy
beam.uz_th                      = sigma_uz

###############
### LATTICE ###
###############
lattice.elements = drift1 quad1 drift2 quad2 drift3
drift1.type = drift
drift1.ds   = L_drift1
quad1.type  = quad
quad1.ds    = L_quad
quad1.dBdx  = -quad_gradient
drift2.type = drift
drift2.ds   = L_drift2
quad2.type  = quad
quad2.ds    = L_quad
quad2.dBdx  = quad_gradient
drift3.type = drift
drift3.ds   = L_drift3

###################
### DIAGNOSTICS ###
###################
warpx.reduced_diags_names = beam_stats
beam_stats.type = BeamRelevant
beam_stats.species = beam
beam_stats.intervals = 1

diagnostics.diags_names = particles_in
particles_in.intervals = floor(nt/20)
particles_in.diag_type = Full
particles_in.species = beam
particles_in.fields_to_plot = none
particles_in.format = openpmd
particles_in.openpmd_backend = bp
particles_in.dump_last_timestep = 1
Some notable details:
Space charge effects: Space charge is computed self-consistently by solving the Poisson equation at each timestep using the updated charge density from the particle distribution. This allows the beam’s own fields to affect its dynamics.
-
Turning off space charge: To turn off space charge effects, set
algo.maxwell_solver = noneand comment out the following inputs: External fields: To initialize an arbitrary external field (such as the quadrupole magnets in a FODO cell), check out the external fields documentation for details on how to define fields analytically or load them from files.
Run
First things first. Create a new folder where you copy the input file. The simulation should be small enough that you can run it in serial with the Conda installation of WarpX.
If you want to make the simulation faster and/or bigger, then you should run with the parallel version of WarpX. The optimal setup to run the simulation depends on your hardware. This is an example that should work on many common laptops, even though it might not be ideal.
With the default parameters, it may take a while on a laptop. If you have access to a GPU, you can experience the speed-up yourself. My experiments: 35 seconds on an NVIDIA A100 GPU, more than 1 hour on 4 cores of my 12th Gen Intel(R) Core(TM) i9-12900H.
Visualize
With Python 🐍
Now that we have the results, we can analyze them using Python.
We will use the openPMD-viewer library
to grab the data that the simulation produced in openPMD
format. Here you can find a
few tutorials on how to use the viewer. If you feel nerdy and/or you
need to deal with the data in parallel workflows, you can use the openPMD-api.
As an example for the FODO cell simulation, we have developed a simple Jupyter notebook where we retrieve the beam variables and analyze the beam dynamics through the cell.
Here is a video of the beam travelling through the FODO cell:
You can download the notebook and try it yourself. Remember to either run the notebook from the simulation directory or change the corresponding path in the notebook.
🎯 Particle tracking follows individual particles, while envelope tracking follows the beam envelope - particle tracking is more detailed but computationally expensive.
🔬 A FODO cell is a periodic focusing structure with alternating focusing and defocusing quadrupole magnets.
⚡ WarpX allows you to turn space charge effects on/off and define arbitrary external fields.
🚀 WarpX is a full PIC code best suited for strong space charge effects and complex electromagnetic interactions. For cases with negligible space charge, ImpactX may be a more efficient choice.
🔍 The documentation is the first place to look for answers, otherwise check out our issues and discussions and ask there.
📷 To analyze and visualize the simulation results in openPMD format, you can use the openPMD-viewer library for Python.
Content from A Laser-Driven Ion Accelerator
Last updated on 2026-04-08 | Edit this page
Estimated time: 40 minutes
Overview
Questions
How does an intense laser pulse accelerate ions from a thin solid target?
Objectives
Set up, run, and visualize a 2D Target Normal Sheath Acceleration (TNSA) simulation with WarpX. Understand the role of key laser and target parameters in determining the maximum ion energy.
Introduction
Target Normal Sheath Acceleration (TNSA) is one of the most studied mechanisms for laser-driven ion acceleration. The physics goes roughly as follows:
- An intense, short-pulse laser (\(I > 10^{18}\) W/cm\(^2\)) hits a thin solid-density target.
- The laser heats electrons at the front surface to relativistic energies.
- These hot electrons traverse the target and escape from the rear surface, setting up a strong electrostatic sheath field (\(\sim\) TV/m) at the target-vacuum interface.
- This sheath field ionizes and accelerates ions (typically protons from surface contaminants) to multi-MeV energies in the direction normal to the target surface.
In this episode, we simulate this process in 2D using a laser pulse impinging on a composite target: a boron slab (the main target) followed by a thin hydrogen contaminant layer from which protons are accelerated.
This simulation is significantly more demanding than the instability examples. Depending on the resolution you choose, you may need a GPU or a parallel run to complete it in a reasonable time.
Setup
Make sure to download the input file.
Whenever you need to prepare an input file, this is where you want to go.
OUTPUT
####################
### MY CONSTANTS ###
####################
my_constants.micro = 1e-6
my_constants.femto = 1e-15
my_constants.eV = q_e
# LASER
my_constants.FWHM_I = ...*femto # [s]
my_constants.laser_tpeak = 2*FWHM_I # [s]
my_constants.laser_waist = ...*micro # [m]
my_constants.laser_wavelength = ...*micro # [m]
my_constants.a0 = ... # [-]
# PLASMA
my_constants.n_c = epsilon0 * m_e * (2*pi*clight)**2 /(laser_wavelength*q_e)**2 # [m^-3]
my_constants.ne0 = ...*n_c # [m^-3]
my_constants.Te0 = ...*eV # [J]
my_constants.zmin_targ = 2*FWHM_I*clight # [m]
my_constants.thick_targ = ...*micro # [m]
my_constants.thick_cont = ...*micro # [m]
# BOX
my_constants.Lz = 4*FWHM_I*clight
my_constants.Lx = 10*laser_waist
my_constants.nz = ...
my_constants.nx = ...
my_constants.dx = Lx / nx
my_constants.dz = Lz / nz
# TIME
my_constants.cfl = ...
my_constants.T = 2*Lz/clight
my_constants.dt = cfl*dx/(sqrt(2)*clight)
my_constants.nt = floor(T/dt)

##########################
### GENERAL PARAMETERS ###
##########################
stop_time = T
amr.n_cell = nx nz
amr.max_level = 0
geometry.dims = 2
geometry.prob_lo = -0.5*Lx  0
geometry.prob_hi =  0.5*Lx  Lz

##########################
### BOUNDARY CONDITION ###
##########################
boundary.field_lo = pml pml
boundary.field_hi = pml pml
boundary.particle_lo = absorbing absorbing absorbing
boundary.particle_hi = absorbing absorbing absorbing

###############
### NUMERICS ###
################
algo.particle_shape = 3
algo.maxwell_solver = yee
algo.particle_pusher = boris
algo.current_deposition = esirkepov
warpx.cfl = cfl
warpx.use_filter = 1

#################
### PARTICLES ###
#################
particles.species_names = ion_targ ele_targ ion_cont ele_cont

ion_targ.species_type = boron
ion_targ.injection_style = NRandomPerCell
ion_targ.num_particles_per_cell = 20
ion_targ.momentum_distribution_type = maxwell_boltzmann
ion_targ.theta = Te0 / (10*m_p*clight**2)
ion_targ.zmin = zmin_targ
ion_targ.zmax = zmin_targ + thick_targ
ion_targ.profile = constant
ion_targ.density = ne0/5

ele_targ.species_type = electron
ele_targ.injection_style = NRandomPerCell
ele_targ.num_particles_per_cell = 40
ele_targ.momentum_distribution_type = maxwell_boltzmann
ele_targ.theta = Te0 / (m_e*clight**2)
ele_targ.zmin = zmin_targ
ele_targ.zmax = zmin_targ + thick_targ
ele_targ.profile = constant
ele_targ.density = ne0

ion_cont.species_type = proton
ion_cont.injection_style = NRandomPerCell
ion_cont.num_particles_per_cell = 100
ion_cont.momentum_distribution_type = maxwell_boltzmann
ion_cont.theta = Te0 / (m_p*clight**2)
ion_cont.zmin = zmin_targ + thick_targ
ion_cont.zmax =  zmin_targ + thick_targ + thick_cont
ion_cont.profile = constant
ion_cont.density = 5*n_c

ele_cont.species_type = electron
ele_cont.injection_style = NRandomPerCell
ele_cont.num_particles_per_cell = 50
ele_cont.momentum_distribution_type = maxwell_boltzmann
ele_cont.theta = Te0 / (m_e*clight**2)
ele_cont.zmin = zmin_targ + thick_targ
ele_cont.zmax = zmin_targ + thick_targ + thick_cont
ele_cont.profile = constant
ele_cont.density = 5*n_c

#############
### LASER ###
#############
lasers.names        = laser1
laser1.position     = 0 0 dz
laser1.direction    = 0. 0. 1.
laser1.polarization = 1. 0. 0.
laser1.a0           = a0
laser1.wavelength   = laser_wavelength
laser1.profile      = Gaussian
laser1.profile_waist = laser_waist
laser1.profile_duration = FWHM_I/1.17741
laser1.profile_t_peak = laser_tpeak
laser1.profile_focal_distance = zmin_targ

################
#### DIAGNOSTICS
################
# FULL
diagnostics.diags_names = fields particles
fields.diag_type = Full
fields.fields_to_plot = Ex Ez rho_ele_targ rho_ion_targ rho_ele_cont rho_ion_cont
fields.format = openpmd
fields.intervals = floor(nt/200)
fields.openpmd_backend = bp
fields.write_species = 0
particles.diag_type = Full
particles.format = openpmd
particles.openpmd_backend = bp
particles.species = ele_targ ion_cont
particles.fields_to_plot = none
particles.intervals = floor(nt/200)

# REDUCED
warpx.reduced_diags_names = FieldEnergy FieldMaximum
FieldEnergy.type = FieldEnergy
FieldEnergy.intervals = 1
FieldMaximum.type = FieldMaximum
FieldMaximum.intervals = 1
Choosing the parameters
You will notice that some parameters in the input file are set to
... (ellipsis). These are left for you to
choose! This is the most complex input of the tutorial, and the
parameter choices will determine whether you get meaningful physics out
of the simulation.
Choose the laser parameters
| Parameter | Symbol | Description |
|---|---|---|
FWHM_I |
\(\tau_{\mathrm{FWHM}}\) | Pulse duration (FWHM of intensity) \([\mathrm{s}]\) |
laser_waist |
\(w_0\) | Laser spot size (beam waist) \([\mathrm{m}]\) |
laser_wavelength |
\(\lambda\) | Laser wavelength \([\mathrm{m}]\) |
a0 |
\(a_0\) | Normalized vector potential (dimensionless laser amplitude) |
- A Ti:Sapphire laser has \(\lambda \approx 0.8\,\mu\mathrm{m}\). This is the most common choice.
- Typical ultrashort pulses have durations \(\tau_{\mathrm{FWHM}} \sim 20\)–\(100\) fs.
- The normalized vector potential \(a_0\) controls the laser intensity: \(I \approx 1.37 \times 10^{18}\, (a_0 / \lambda[\mu\mathrm{m}])^2\) W/cm\(^2\). For TNSA, \(a_0 \gtrsim 1\) (i.e. relativistic intensity) is required. Values of \(a_0 \sim 1\)–\(10\) are typical.
- The laser waist \(w_0\) is typically a few micrometers (\(\sim 2\)–\(10\,\mu\mathrm{m}\)).
Choose the target parameters
| Parameter | Symbol | Description |
|---|---|---|
ne0 |
\(n_e / n_c\) | Electron density of the main target, in units of the critical density \(n_c\) |
Te0 |
\(T_e\) | Initial electron temperature \([\mathrm{eV}]\) |
thick_targ |
Thickness of the main (boron) target \([\mathrm{m}]\) | |
thick_cont |
Thickness of the hydrogen contaminant layer \([\mathrm{m}]\) |
- Solid-density targets have \(n_e \sim 100\)–\(500\, n_c\), where \(n_c\) is the critical density for the chosen wavelength. However, running at full solid density is very expensive. You may want to start with a reduced density \(\sim 10\)–\(50\, n_c\) to keep the cost manageable.
- The initial temperature is typically a few eV (room temperature ionized material), but the exact value does not matter much since the laser will heat the electrons far beyond this.
- The target thickness is usually a few micrometers (\(\sim 1\)–\(10\,\mu\mathrm{m}\)). Thinner targets lead to higher maximum proton energies (up to a point).
- The contaminant layer is very thin (\(\sim 0.1\)–\(1\,\mu\mathrm{m}\)).
Choose the numerical parameters
| Parameter | Description |
|---|---|
nz |
Number of grid cells in the laser propagation direction |
nx |
Number of grid cells in the transverse direction |
cfl |
CFL number (must be \(< 1/\sqrt{2}\) in 2D) |
- You need to resolve the laser wavelength: \(\Delta z \lesssim \lambda / 20\) is a common rule of thumb, with \(\lambda / 30\) or finer being safer.
- The transverse resolution can be somewhat coarser than the longitudinal, but should still resolve \(c/\omega_{pe}\) for the target density.
- A CFL of \(\sim 0.7\) (i.e. \(1/\sqrt{2}\)) is the maximum allowed.
- For a first test, use a coarser grid to make sure the simulation runs correctly, and then refine.
Notable details
The target consists of four species: boron ions and electrons for the main target (
ion_targ,ele_targ), and protons and electrons for the contaminant layer (ion_cont,ele_cont). The boron is initialized with charge state \(Z=5\), so the electron density is \(5\times\) the ion density.The laser is injected from the \(z_{\mathrm{min}}\) boundary using the built-in Gaussian laser profile, with the focus placed at the front surface of the target.
PML (Perfectly Matched Layer) boundary conditions are used for the fields to absorb outgoing electromagnetic waves, and absorbing boundary conditions are used for particles leaving the box.
The
current_deposition = esirkepovoption is used to ensure charge conservation, which is essential for a simulation involving dense plasma and strong fields.The diagnostics write out both field data (
Ex,Ez, charge densities of each species) and particle data (target electrons and contaminant protons).
Run
Create a new folder and copy the input file there, after filling in your chosen parameters.
This simulation is more expensive than the instability examples. Depending on your resolution, running in serial may take a very long time. Consider running in parallel or on a GPU.
You should see a standard output flashing out a lot of info.
At the end, you should find in your folder:
- a subfolder
diags/with the full field and particle diagnostics
- files
FieldEnergy.txtandFieldMaximum.txtwith the reduced diagnostics, insidediags/reducedfiles/
- a file called
warpx_used_inputs: a summary of the inputs that were used to run the simulation
If that’s the case, yey! 💯
If the run went wrong, you may find a Backtrace.0.0 file
which can be useful for debugging purposes. Let me know if the code
fails in any way!
Visualize
With Python 🐍
Now that we have the results, we can analyze them using Python.
We will use the openPMD-viewer library
to grab the data that the simulation produced in openPMD format. Here you can find a
few tutorials on how to use the viewer. If you feel nerdy and/or you
need to deal with the data in parallel workflows, you can use the openPMD-api.
Here are some things you can visualize:
Electric field maps: plot
ExandEzat several time snapshots to see the laser pulse entering the box, interacting with the target, and the sheath field forming at the rear surface.Charge density maps: plot the charge densities (
rho_ele_targ,rho_ion_cont, etc.) to see the electron heating, expansion, and proton acceleration.Proton energy spectrum: from the contaminant proton data (
ion_cont), compute the kinetic energy of each proton and build a histogram. The maximum proton energy is the key figure of merit in TNSA experiments.Field energy vs time: use
FieldEnergy.txtto track how the electromagnetic energy in the box evolves as the laser enters, interacts, and exits.
With a Jupyter notebook 📓
The notebook includes a field map with the laser electric field overlaid on the target electron density, and a phase-space plot of the accelerated contaminant protons.
You can download the notebook and try it yourself. Remember to either run the notebook from the simulation directory or change the corresponding path in the notebook.
Questions for analysis
Describe what you observe in the field maps and charge density plots at different times. Can you identify the laser entering, the electron heating, and the proton acceleration?
What is the maximum proton energy you observe? How does it compare to the theoretical TNSA scaling with laser intensity \(a_0\)?
How does the sheath field \(E_z\) at the target rear surface evolve in time? Can you identify the moment when the sheath field is strongest?
Try running the simulation with a thinner (or thicker) target. How does the maximum proton energy change? Why?
What happens if you increase \(a_0\) (i.e., increase the laser intensity)? How does the proton energy spectrum change?
Look at the electron density behind the target. Can you see the hot electron population that escapes and creates the sheath?
What role does the contaminant layer play? What would happen if you made it thicker, or changed the contaminant species to something heavier (e.g., carbon)?
These are open-ended questions meant to guide your exploration. A classical TNSA scaling predicts the maximum proton energy \(E_{\max} \propto a_0\) (or \(\propto \sqrt{I}\)), though the exact scaling depends on target thickness, density, and pulse duration. Thinner targets generally yield higher maximum energies because the hot electrons recirculate more efficiently.
💡 TNSA accelerates ions via a strong electrostatic sheath field created by hot electrons escaping the rear surface of a laser-irradiated thin target.
🔬 Key parameters controlling the maximum ion energy are the laser intensity (\(a_0\)), the target thickness, and the target density.
⚙️ Charge-conserving current deposition (esirkepov) and
proper boundary conditions (PML, absorbing) are essential for this type
of simulation.
⚡ This is a computationally expensive simulation – be prepared to iterate on resolution and target density to find a balance between physical fidelity and computational cost.
🔍 The documentation is the first place to look for answers, otherwise check out our issues and discussions and ask there.
📷 To analyze and visualize the simulation results in openPMD format, you can use the openPMD-viewer library for Python.
Content from A Laser Wakefield Accelerator
Last updated on 2026-09-23 | Edit this page
Estimated time: 35 minutes
Overview
Questions
- 🏄 How can electrons catch a ride on a laser-driven plasma wave?
- 🧩 How do particles, a grid, and a moving window bring this system into the computer?
- 🔍 What can we discover in the density, electric-field, and energy plots?
Objectives
- 🔦 Identify the laser, plasma target, and wake in a reduced 3D simulation.
- 📏 Connect spatial and temporal resolution to the scales of the laser and plasma.
- 🚀 Run WarpX and visualize saved field and particle diagnostics.
- 🕵️ Distinguish evidence of a wake from evidence of a usable accelerated bunch.
Surfing a plasma wave
Imagine electrons surfing a wave, with a laser providing the push that creates it. 🏄 The wave here is a pattern of charge and electric field in a plasma, and riding the right part of it can give electrons energy.
A plasma contains free electrons and ions. An intense laser pulse pushes electrons out of its path. The heavier ions respond much more slowly, so the separation of positive and negative charge produces an electric field. The electrons move back toward the ions and can oscillate, leaving a wake behind the pulse. Electrons traveling in the appropriate part of that wake can gain energy from its electric field. This is laser-wakefield acceleration.
WarpX can model how a laser and plasma evolve together and how electrons respond to the resulting fields. Read Introduction to WarpX for the particle-in-cell (PIC) method. Here you will launch a laser into a small plasma target, watch the wake develop, and inspect the electron energy distribution. This reduced setup has been run on an 8 GB GPU.
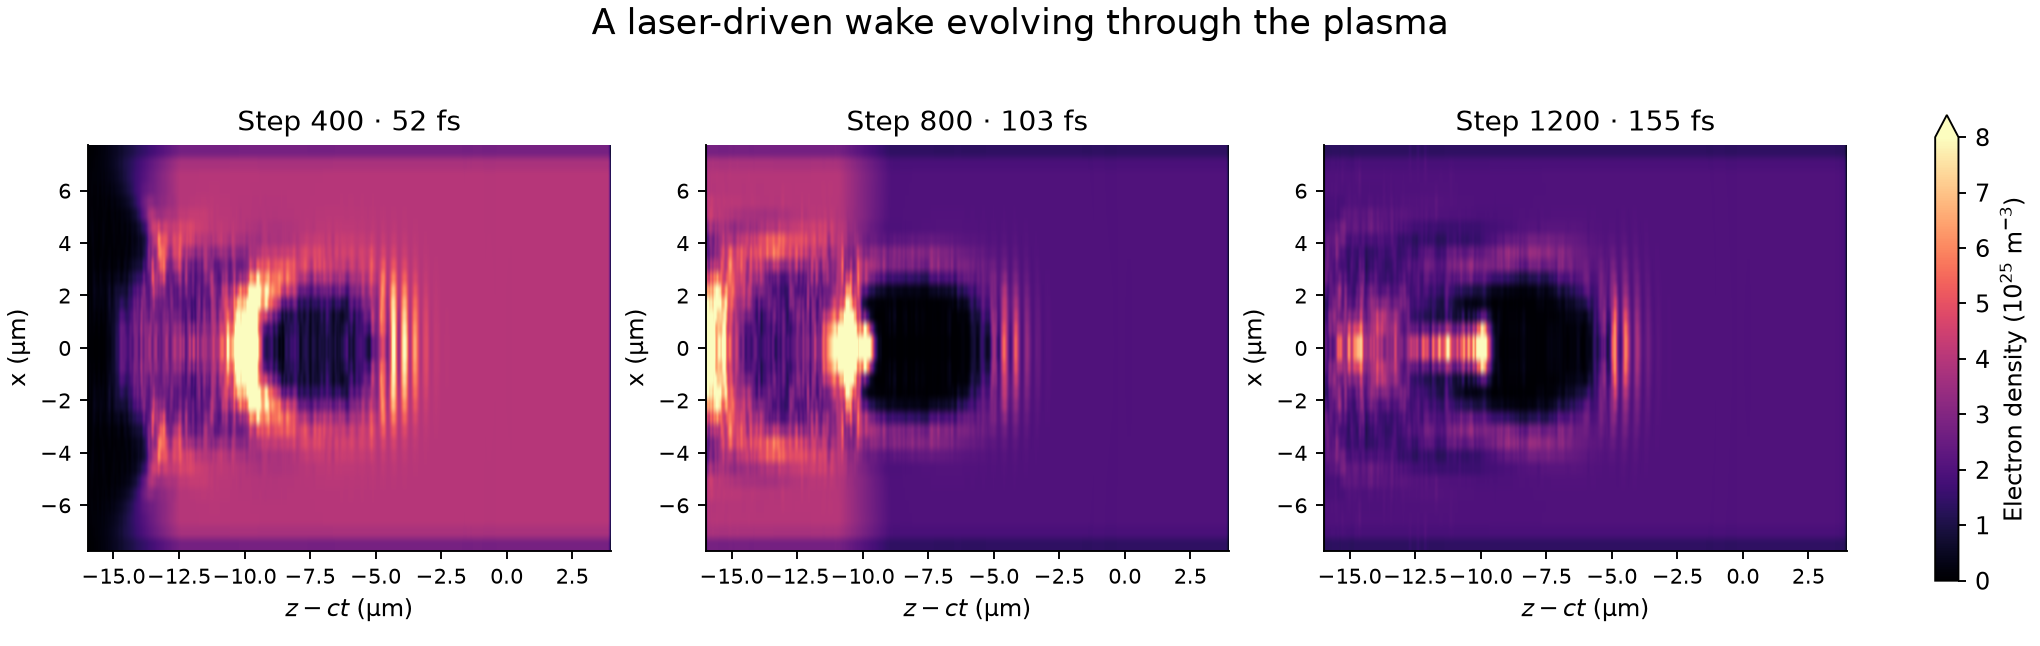
The laser and the plasma
There are three members of the cast:
- 🔦 The laser: a short pulse traveling along z, with its electric field polarized along y. Its temporal and transverse envelopes are Gaussian.
- ⚡ The electrons: mobile particles that respond to the fields and form the wake.
- ⚓ The helium ions: a fixed positive background in this teaching model. Two electrons per fully ionized helium ion make the initial plasma neutral.
The plasma starts already ionized; we do not simulate the removal of electrons from atoms.
The target has an entrance ramp, a high-density region, a short density drop, and a lower-density region followed by an exit ramp. The drop changes the wake as the laser crosses it. Density transitions can help electrons become trapped in a wake, but a drop alone does not guarantee a useful accelerated bunch in this particular calculation.
| Physical setting | Default | Where to find it in the input |
|---|---|---|
| Laser wavelength | 0.8 µm | lambda0 |
| Dimensionless laser strength | a0 = 3 | a0 |
| Laser waist | 3 µm, field radius at 1/e of its peak |
w0, derived from spot_fwhm
|
| Pulse duration | 6 fs, intensity full width at half maximum | duration_fwhm |
| Laser focus | z = 10 µm | z_foc |
| Electron density before/after the drop | 4 × 10^25 / 2 × 10^25 m^-3 |
n_up, n_down
|
| Entrance ramp | z = 0–3 µm |
z_entrance, L_entrance
|
| Density drop | z = 20–22 µm |
z_transition, L_transition
|
| Exit ramp | z = 50–55 µm |
z_plasma_end, L_exit
|
The constants appear as my_constants.<name> in the
input.
Represent the accelerator numerically
WarpX samples the plasma with computational particles and evolves the electric and magnetic fields on a 3D Cartesian grid. Particles and fields affect one another at each step. The input selects the CKC electromagnetic solver and a first-order particle shape, which distributes a macroparticle’s charge to nearby grid points.
The simulation domain moves along z to follow the laser. Think of the moving window as a camera following the action 🎥. It moves at the speed of light, keeping the laser and wake in view. Fresh plasma is loaded as the window advances into the target, while material behind it leaves the calculation. This keeps the computational volume small without shortening the target to the instantaneous box length. Absorbing field and particle boundaries allow outgoing disturbances and particles to leave the domain.
| Numerical setting | Default |
|---|---|
| Moving box size | 16 × 16 × 20 µm |
| Grid cells | 32 × 32 × 512 = 524,288 |
| Cell spacing | 0.5 × 0.5 × 0.0390625 µm |
| Initial sampling where plasma is loaded | One macroparticle per cell per species |
| Time step | Approximately 0.129 fs |
| Number of steps | 1,836 |
| Saved diagnostics | Every 200 steps and at the end |
📏 These tiny scales explain the computing work. The longitudinal spacing samples the laser wavelength with about 20 cells. With this solver, the smallest cell spacing also constrains the time step. Finer resolution therefore increases both the work per step and the number of steps needed for the same physical duration. A GPU executes many particle and grid operations concurrently.
Get ready to run
Use a WarpX installation with 3D support. The Python script requires
pywarpx, and diagnostic output requires openPMD support.
Analysis uses Jupyter, NumPy, Matplotlib, SciPy, and
openpmd-viewer. A GPU run needs a GPU-enabled WarpX build.
The tutorial
container provides the software and instructions for GPU access. For
other systems, see the WarpX
installation documentation. CPU execution is also possible, but can
take substantially longer.
For the hosted workshop, follow the LLNL
launch instructions and use the included files. For independent use,
the same example is in episodes/files/laser-wakefield/:
-
Analysis
notebook and helper script in
laser-wakefield/. -
Input
file and Python
driver together in
laser-wakefield/.
Download the example
In a JupyterLab terminal, start in a folder visible in the file
browser. If laser-wakefield/ is missing, download the
repository archive and extract only this example:
BASH
wakefield_archive=$(mktemp)
curl -fL https://github.com/BLAST-WarpX/warpx-tutorials/archive/refs/heads/main.tar.gz \
  -o "$wakefield_archive" && \
tar -xzf "$wakefield_archive" --strip-components=3 \
  warpx-tutorials-main/episodes/files/laser-wakefield
rm -f "$wakefield_archive"
This creates laser-wakefield/ in your current directory.
Refresh the file browser to see it. If the folder already exists, use it
and preserve any modified inputs or previous results before downloading
a replacement.
Launch the laser! 🚀
From laser-wakefield/, activate your WarpX environment
and run:
In the tutorial container, activate the GPU environment with
source /opt/venv-gpu/bin/activate before this command. On
other systems, activate your own installation. With a native WarpX
executable, you can instead use
warpx.3d lwfa_warpx_input.txt from the same directory.
The driver reads the input file and saves diagnostics under
diags/diag1. It does not create a new
output directory for each run. Before repeating, preserve the completed
diags/ folder and run.log under new, unused
names. The elapsed time reported by time is the computer’s
runtime, distinct from the femtoseconds covered by the simulated plasma
evolution.
⏱️ While WarpX works, peek at its progress with
tail -n 20 run.log in a second terminal in the same
directory. A previously completed run with these settings took 8
minutes 25 seconds on an RTX A2000 8 GB laptop GPU. Runtime
will differ on other machines. When the prompt returns, check the log
for successful completion before opening the diagnostics.
While it runs, look at the parameter tables above. Which direction has the smallest grid spacing? How does that choice help us follow the laser?
Interpret the results
Open wakefield.ipynb from
the laser-wakefield folder after the run finishes. Select
the kernel containing the analysis packages; in the tutorial container,
WarpX GPU provides them. Plotting saved data itself
does not require a GPU. The notebook reads diags/diag1 and
does not launch the simulation.
Time to see what happened! 🔍 Use the plots together:
- 🫧 Find the cavity — electron density: a slice at y = 0 reveals the electron-depleted cavity and the surrounding concentration of electrons. The three-frame figure uses a shared color scale and the coordinate z−ct, which moves at the speed of light to keep the wake in view. Compare how the cavity changes as the laser crosses the density drop.
- ⚡ Find the push — longitudinal electric field, Ez: positive and negative regions show the direction of the field along the beam axis. Electrons have negative charge, so the longitudinal electric force is opposite to Ez. An electron moving forward can gain energy where this force points forward. In the single-snapshot figure, white contours on the density panel show the magnitude of Ey to help locate the pulse. Ey is the total transverse electric field and also includes plasma fields.
- 📈 Find the energetic electrons — the energy spectrum: the horizontal axis is kinetic energy and the vertical axis is charge magnitude per energy bin. Particle weights account for the physical electrons represented by each macroparticle. The spectrum includes all electrons in the moving window, not a selected bunch.
The single-snapshot density and field panels use laboratory z, while the three-frame density figure uses z−ct. Read the axis labels when comparing them. Choose a saved step during propagation: the last frame is after the moving window has passed the plasma and is less useful for viewing the wake.
💡 Follow the clues: locate the laser contours, then the cavity behind it. Find a region where the electric field would accelerate a forward-moving electron. Finally, inspect the energy spectrum. These views tell different parts of the same story; the spectrum alone does not show where those electrons are.
The notebook starts with a raw electron-charge histogram and a slice
of the total transverse field Ey, which includes both laser
and plasma fields. Its density-evolution plots use the moving coordinate
z-ct. In the single-snapshot figure, white contours show
|Ey|; the spectrum includes all electrons still in the
moving box, including untrapped plasma electrons.
The fourth snapshot panel reads ParticleEnergy.txt and
FieldEnergy.txt from diags/reducedfiles/,
saved every simulation step. It compares total particle kinetic energy
(all species) and electromagnetic field energy in mJ versus physical
time in fs; the dashed line marks the selected snapshot. Laser injection
and particles and fields crossing the moving box boundaries mean their
sum need not stay constant. If these files are missing from an older
run, preserve its diagnostics and rerun with the current input.
To save your figures without opening Jupyter, run these commands from
laser-wakefield/:
Your turn: change one thing 🎛️
Keep the baseline input and results so you have something to compare with. Then choose one of these experiments. Make a prediction before rerunning!
Turn the laser knob 🔦
Change my_constants.a0, the laser strength, and rerun.
Compare the cavity, Ez, and spectrum at the same saved step. Does the
cavity change shape? Does the high-energy part of the spectrum change
too?
Alternatively, set n_up equal to n_down to
remove the density drop while keeping the entrance and exit ramps. Watch
how the wake evolves through the region where the drop used to be.
Change one parameter at a time so you can connect a difference in the
plots to a change in the input.
Take fewer snapshots 📸
Change diag1.intervals from 200 to
400, then compare elapsed runtime, disk use
(du -sh diags), and the available snapshots. What do you
save in storage, and which moments can you no longer inspect?
The physical input and time steps are unchanged; only the saved history is less frequent. Compare a step saved in both runs. The computer still has to advance through every time step, even when it does not save a snapshot!
Regular versus random particle placement
The raw electron histogram can show horizontal stripes: the baseline
places one macroparticle per cell on a regular grid, and the histogram
bins resolve those rows. Try randomizing the electron positions within
each cell. In lwfa_warpx_input.txt, replace
electrons.injection_style = "NUniformPerCell"
electrons.num_particles_per_cell_each_dim = 1 1 1
with
electrons.injection_style = "NRandomPerCell"
electrons.num_particles_per_cell = 1
Remove the old num_particles_per_cell_each_dim line.
Keep the density, grid, momentum distribution, and other settings fixed.
These two loading styles use different
particle-count parameters.
Preserve the baseline diagnostics before rerunning. Compare the electron histogram and deposited-density plot at the same saved step. Do the regular bands disappear? How much random variation appears instead?
This keeps one macroparticle per cell but changes its position. Random loading can replace regular sampling patterns with statistical noise and can affect the simulated fields, especially at this low particle count. A less striped plot alone does not demonstrate greater physical accuracy.
How far can we trust the picture? 🔍
A striking picture is a starting point for investigation. The compact laser and target make this visual demonstration practical. The simulation uses fixed, already-ionized helium ions, low particle sampling, and a grid that has not been refined to establish numerical convergence. It does not establish experimental beam quality or a target beam energy.
A wake and a high-energy tail demonstrate different things. Identifying a usable accelerated bunch also requires examining its spatial and momentum distribution, charge, and evolution after it leaves the plasma.
For other laser-wakefield configurations, including the role of geometry, see the official WarpX LWFA examples. The numerical choices here belong to this reduced teaching model and should be reassessed for a research calculation.
- 🏄 A laser drives a plasma wake; its longitudinal field can accelerate electrons.
- 🧩 The grid, particles, and time steps determine which features are resolved and how much computation is required.
- 🔍 Density, field, and energy plots provide complementary evidence; an energy spectrum alone does not identify an accelerated bunch.
- 🎛️ Save the baseline and vary one setting at a time to interpret changes.
Content from A Beam Transport Line
Last updated on 2026-09-23 | Edit this page
Estimated time: 35 minutes
Overview
Questions
- 🧲 How do magnets guide and focus an electron bunch?
- 🔍 How can beam screens reveal changes along a beamline?
- 🧩 What changes when we track independent particles instead of evolving a plasma?
Objectives
- Identify drifts, quadrupoles, dipoles, and diagnostic screens.
- Run an ImpactX simulation and connect beam shapes to the magnet sequence.
- Distinguish particle sampling from physical bunch charge.
- Interpret beam-size plots within the assumptions of the model.
From an electron source to a beamline
An electron bunch needs guidance after it leaves its source. Magnets steer its trajectory and focus it toward the next experiment. Here, ImpactX tracks a bunch through the Hundred-Terawatt Undulator (HTU) beamline at LBNL’s BELLA Center, using the magnet sequence from the ImpactX HTU example. See Introduction to ImpactX for the beam-dynamics background. The bunch in this example is sampled from a Gaussian distribution.
The bunch and its numerical representation
| Setting | Default | Notebook variable |
|---|---|---|
| Particle species | Electrons | Reference particle charge and mass |
| Bunch and reference total energy | 100 MeV, including rest energy | reference_total_energy_MeV |
| Bunch charge magnitude | 25 pC | bunch_charge=25e-12 |
| Number of macroparticles | 10,000 | particles |
| Normalized transverse emittance | 1.5 µm in each plane | Gaussian distribution setup |
| Space charge | Off | sim.space_charge = False |
Each macroparticle represents many electrons. Increasing
particles samples the same 25 pC bunch more finely; it does
not increase its charge.
The notebook defines the reference particle, Gaussian bunch, lattice,
and tracking calls in run_beam. The reference-particle API
takes kinetic energy, so the code subtracts electron
rest energy from the specified total energy. The twiss(...)
call supplies distribution parameters; dividing normalized transverse
emittance by βγ gives geometric emittance.
Particles move through prescribed magnets without collective fields. Space charge, radiation, and apertures are not modeled. The screens record the beam without clipping it, so a charge check cannot establish whether the beam would fit through real openings.
Get ready to run
Use the tutorial
setup instructions for Docker or Conda. They provide ImpactX,
Jupyter, and the analysis packages. For independent use, the files live
in episodes/files/beam-transport/:
- htu_transport.ipynb defines and runs the simulation.
- impactx_helpers.py provides analysis and plotting utilities. Keep it alongside the notebook.
If you downloaded only the workshop folder during setup, obtain the standalone example from the repository root with:
In the tutorial container or a full repository checkout, the example is already included.
The first code cell downloads htu_lattice.py from the
pinned ImpactX 26.09 example if it is missing, so the first run needs
network access. Existing local copies are kept. The lattice uses its
default chicane setting.
For the hosted workshop, follow the LLNL launch instructions.
Track the bunch
Open the notebook from beam-transport/ and select a
kernel with ImpactX and the analysis packages. In the tutorial container
this is WarpX CPU, which includes ImpactX. Keep the
default particle count and energy, and run sections 1–3 in order.
The simulation runs directly in the notebook kernel. Each call
creates a new transport-* folder under
beam-transport/runs/, containing diagnostics and
performance.json. The reported runtime covers setup,
particle generation, tracking, and diagnostic output; it excludes kernel
startup and plotting. run_beam requests two CPU threads via
sim.omp_threads; pass cpu_threads=4, for
example, to change that.
After changing settings, rerun the settings cell, the simulation
call, and the analysis cells. If you edit run_beam itself,
rerun its definition too.
Interpret the results
First open a saved screen with the notebook’s diagnostic-reading
cells. An openPMD series contains iterations and particle species. The
beam species is loaded into a table with one row per
macroparticle. Extract transverse positions and weights, then plot a
charge histogram with Matplotlib. Colors show charge magnitude
per bin, not charge density per unit area.
Use Play screens or the slider to follow the bunch
along the beamline. These are snapshots at different locations, not a
movie in physical time. Turn off Zoom to fit to compare
sizes on fixed axes; zoomed maps can switch between µm and mm. The
viewer also saves beam_explorer.html in the run folder,
which can be opened in a browser.
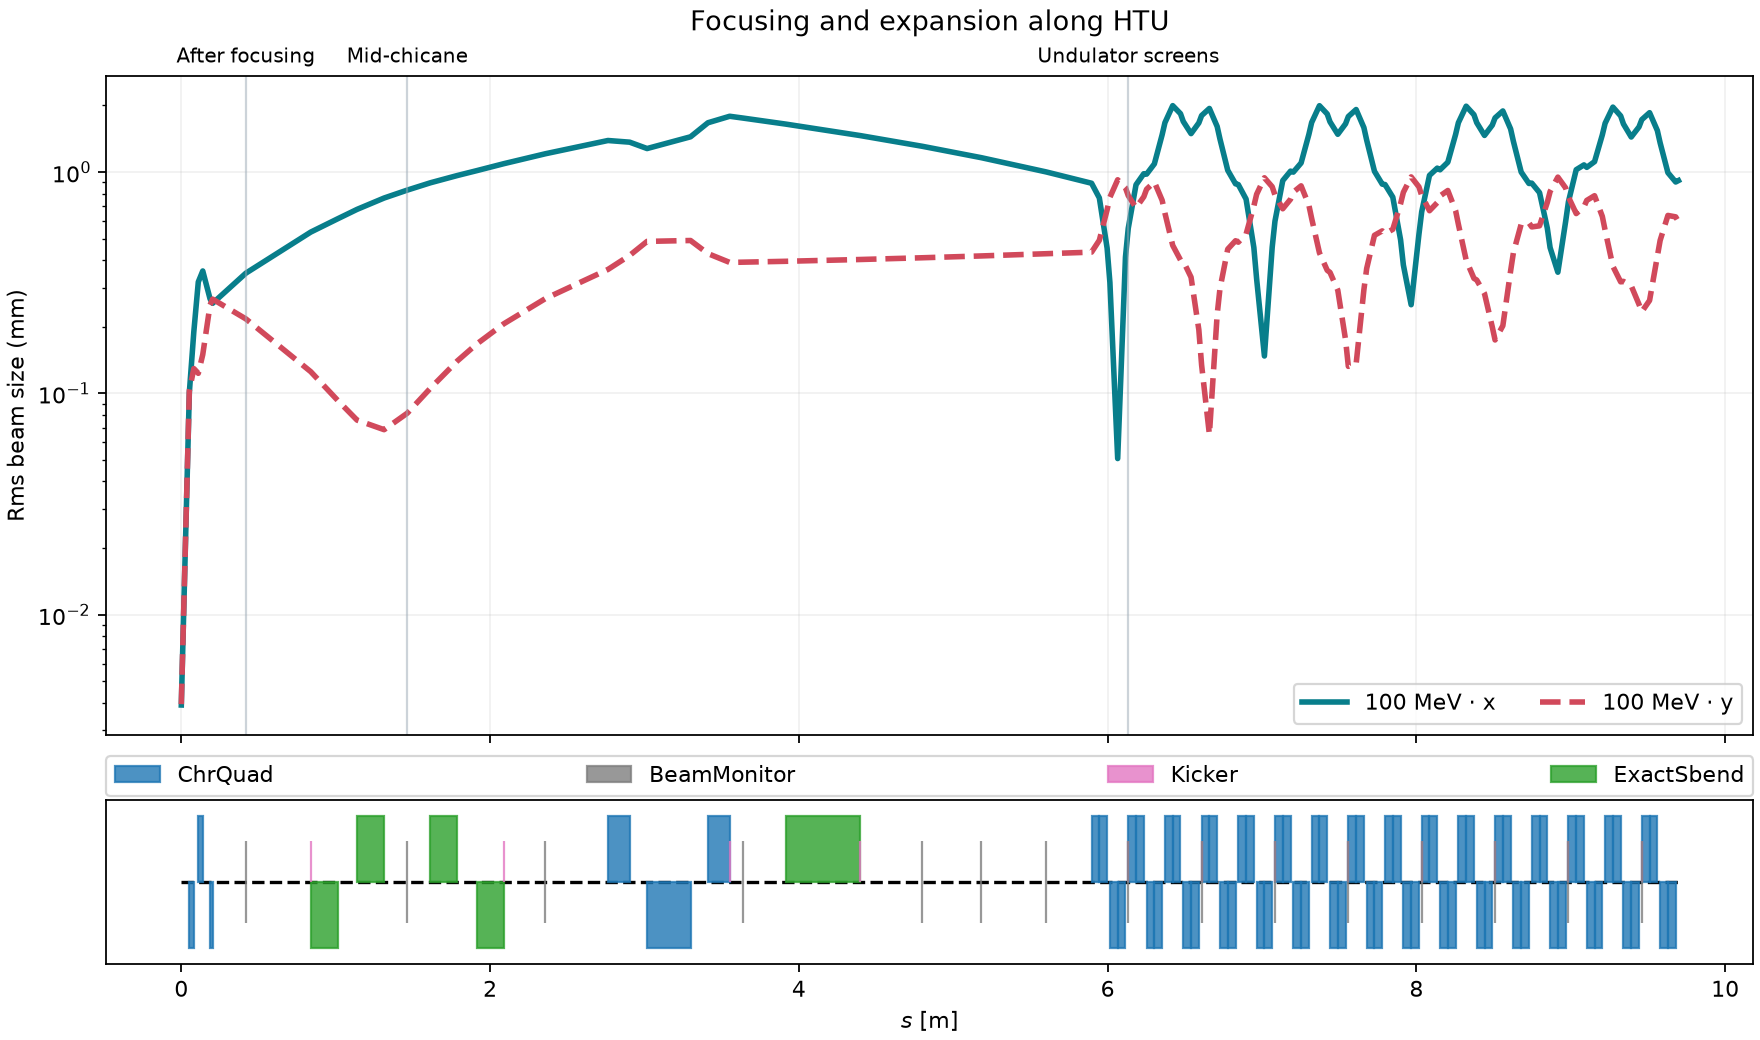
The rms sizes describe the spread of particle positions in x and y. The magnet diagram below the curves shows where the beamline elements sit:
- Drifts: particles travel without magnetic forces. Depending on their incoming angles, the bunch can expand or converge to a waist.
- Quadrupoles: focus in one transverse plane and defocus in the other. Alternating quadrupoles control both planes; compare the waist locations in x and y.
- Chicane dipoles: bend the beam through a sideways detour. Different momenta bend differently, coupling horizontal position to momentum.
- Screens: record the beam at selected locations in this model.
Find TCPhosphor after the initial focusing magnets,
ChicaneSlit in the chicane, and the exit. A size change can
develop downstream of the magnet that changed the particle angles.
Follow the beam
Does the beam stay round? Where is it narrowest in each plane? Connect these changes to the nearby magnets and drifts using both the screen histograms and the rms-size curves.
Change the beam energy
Change reference_total_energy_MeV, then rerun the
settings, simulation, and analysis. This changes both the reference
energy and the center of the bunch distribution. The lattice keeps its
default settings; changing the energy does not retune the magnets. How
do the beam sizes and waist locations change?
Sample the same bunch more finely
Increase particles, keeping the other settings fixed.
Compare the beam’s sampled shape, runtime, and output size. Which
features persist? A smoother histogram alone does not validate the
physical model.
Connecting to a plasma accelerator
Replacing this Gaussian bunch with a plasma-generated source would require selecting the bunch and matching coordinate and momentum conventions. Energy spread, transverse size, divergence, emittance, and charge would all matter for transport. The current examples do not perform that handoff.
- 🧲 Magnets change particle trajectories; drifts allow those changes to develop into different beam sizes.
- 🔍 Screen histograms and rms-size curves connect the bunch to the lattice.
- 🧩 More macroparticles sample the same bunch more finely.
- 📏 The model omits collective fields, radiation, and apertures; interpret its diagnostics within those limits.
Content from A Beam-Beam Collision
Last updated on 2026-04-06 | Edit this page
Estimated time: 30 minutes
Overview
Questions
How to use WarpX for beam-beam simulations of colliders 💥?
Objectives
Learn how to setup, run, and visualize your own beam-beam ☄️☄️ simulation
Setup
In this example we will simulate a bunch of electrons colliding against a bunch of positrons. We have selected the parameters of the C\(^3\) linear collider.
Whenever you need to prepare an input file, this is where you want to go.
OUTPUT
#################################
########## MY CONSTANTS #########
#################################
my_constants.mc2   = m_e*clight*clight
my_constants.nano  = 1.0e-9
my_constants.micro = 1.e-6
my_constants.milli = 1.e-3
my_constants.GeV   = q_e*1.e9

# BEAMS
my_constants.beam_energy = 125*GeV
my_constants.beam_gamma  = beam_energy/mc2
my_constants.beam_npart  = 6.24e9
my_constants.nmacropart  = 1e5
my_constants.beam_charge = q_e * beam_npart
#my_constants.sigmax     = 210.0*nano
#my_constants.sigmay     = 3.1*nano
my_constants.sigmaz      = 100.*micro
my_constants.beam_uth    = 0.3/100*beam_gamma
my_constants.mux         = 0.*sigmax
my_constants.muy         = 0.*sigmay
my_constants.muz         = 4*sigmaz
my_constants.emitx       = 900*nano
my_constants.emity       = 20*nano
my_constants.dux         = emitx / sigmax
my_constants.duy         = emity / sigmay
my_constants.betax       = 12*milli
my_constants.betay       = 0.12*milli
my_constants.sigmax      = sqrt( emitx * betax / beam_gamma )
my_constants.sigmay      = sqrt( emity * betay / beam_gamma )

# BOX
my_constants.Lx = 20*sigmax
my_constants.Ly = 20*sigmay
my_constants.Lz = 16*sigmaz
my_constants.nx = 128
my_constants.ny = 128
my_constants.nz = 64
my_constants.dx = Lx/nx
my_constants.dy = Ly/ny
my_constants.dz = Lz/nz

# TIME
my_constants.T = 0.5*Lz/clight
my_constants.dt = T / nz
my_constants.nt = floor(T/dt)

# LUMI DIAG
my_constants.bin_num_1d = 2048
my_constants.bin_center_min_1d = 0.
my_constants.bin_center_max_1d = 2*beam_energy/q_e
my_constants.bin_size_1d = (bin_center_max_1d - bin_center_min_1d) / bin_num_1d
my_constants.bin_edge_min_1d = bin_center_min_1d - 0.5 * bin_size_1d
my_constants.bin_edge_max_1d = bin_center_max_1d + 0.5 * bin_size_1d
my_constants.bin_num_1d_eff = bin_num_1d + 1

#################################
####### GENERAL PARAMETERS ######
#################################
stop_time = T
amr.n_cell = nx ny nz
amr.max_level = 0
geometry.dims = 3
geometry.prob_lo = -0.5*Lx -0.5*Ly -0.5*Lz
geometry.prob_hi =  0.5*Lx  0.5*Ly  0.5*Lz

#################################
######## BOUNDARY CONDITION #####
#################################
boundary.field_lo = open open open
boundary.field_hi = open open open
boundary.particle_lo = Absorbing Absorbing Absorbing
boundary.particle_hi = Absorbing Absorbing Absorbing

#################################
############ NUMERICS ###########
#################################
warpx.do_electrostatic = relativistic
warpx.const_dt = dt
warpx.grid_type = collocated
algo.particle_shape = 3
algo.particle_pusher = vay
warpx.poisson_solver = fft
warpx.use_2d_slices_fft_solver = 1

#################################
########### PARTICLES ###########
#################################
particles.species_names = ele1 pos2 pho1 pho2 ele2 pos1
particles.photon_species = pho1 pho2

ele1.species_type = electron
ele1.injection_style = gaussian_beam
ele1.x_rms = sigmax
ele1.y_rms = sigmay
ele1.z_rms = sigmaz
ele1.x_m = - mux
ele1.y_m = - muy
ele1.z_m = - muz
ele1.npart = nmacropart
ele1.q_tot = -beam_charge
ele1.z_cut = 4
ele1.focal_distance = muz
ele1.momentum_distribution_type = gaussian
ele1.uz_m = beam_gamma
ele1.uy_m = 0.0
ele1.ux_m = 0.0
ele1.ux_th = dux
ele1.uy_th = duy
ele1.uz_th = beam_uth
ele1.initialize_self_fields = 1
ele1.do_qed_quantum_sync = 1
ele1.qed_quantum_sync_phot_product_species = pho1
ele1.do_classical_radiation_reaction = 0

pos2.species_type = positron
pos2.injection_style = gaussian_beam
pos2.x_rms = sigmax
pos2.y_rms = sigmay
pos2.z_rms = sigmaz
pos2.x_m = mux
pos2.y_m = muy
pos2.z_m = muz
pos2.npart = nmacropart
pos2.q_tot = beam_charge
pos2.z_cut = 4
pos2.focal_distance = muz
pos2.momentum_distribution_type = gaussian
pos2.uz_m = -beam_gamma
pos2.uy_m = 0.0
pos2.ux_m = 0.0
pos2.ux_th = dux
pos2.uy_th = duy
pos2.uz_th = beam_uth
pos2.initialize_self_fields = 1
pos2.do_qed_quantum_sync = 1
pos2.qed_quantum_sync_phot_product_species = pho2
pos2.do_classical_radiation_reaction = 0

pho1.species_type = photon
pho1.injection_style = none
pho1.do_qed_breit_wheeler = 1
pho1.qed_breit_wheeler_ele_product_species = ele1
pho1.qed_breit_wheeler_pos_product_species = pos1

pho2.species_type = photon
pho2.injection_style = none
pho2.do_qed_breit_wheeler = 1
pho2.qed_breit_wheeler_ele_product_species = ele2
pho2.qed_breit_wheeler_pos_product_species = pos2

ele2.species_type = electron
ele2.injection_style = none
ele2.do_qed_quantum_sync = 1
ele2.qed_quantum_sync_phot_product_species = pho2
ele2.do_classical_radiation_reaction = 0

pos1.species_type = positron
pos1.injection_style = none
pos1.do_qed_quantum_sync = 1
pos1.qed_quantum_sync_phot_product_species = pho1
pos1.do_classical_radiation_reaction = 0

#################################
############# QED ###############
#################################
qed_qs.photon_creation_energy_threshold = 0.

qed_qs.lookup_table_mode = builtin
qed_qs.chi_min = 1.e-7

qed_bw.lookup_table_mode = builtin
qed_bw.chi_min = 1.e-2

warpx.do_qed_schwinger = 0.

#################################
######### DIAGNOSTICS ###########
#################################
# FULL
diagnostics.diags_names = particles_out particles_in

# particles that exit the simulation domain at any given time
particles_out.dump_last_timestep = 1
particles_out.diag_type = BoundaryScraping
particles_out.format = openpmd
particles_out.openpmd_backend = h5
particles_out.intervals = -1

ele1.save_particles_at_xlo = 1
ele1.save_particles_at_ylo = 1
ele1.save_particles_at_zlo = 1
ele1.save_particles_at_xhi = 1
ele1.save_particles_at_yhi = 1
ele1.save_particles_at_zhi = 1

pos2.save_particles_at_xlo = 1
pos2.save_particles_at_ylo = 1
pos2.save_particles_at_zlo = 1
pos2.save_particles_at_xhi = 1
pos2.save_particles_at_yhi = 1
pos2.save_particles_at_zhi = 1

pho1.save_particles_at_xlo = 1
pho1.save_particles_at_ylo = 1
pho1.save_particles_at_zlo = 1
pho1.save_particles_at_xhi = 1
pho1.save_particles_at_yhi = 1
pho1.save_particles_at_zhi = 1

pho2.save_particles_at_xlo = 1
pho2.save_particles_at_ylo = 1
pho2.save_particles_at_zlo = 1
pho2.save_particles_at_xhi = 1
pho2.save_particles_at_yhi = 1
pho2.save_particles_at_zhi = 1

ele2.save_particles_at_xlo = 1
ele2.save_particles_at_ylo = 1
ele2.save_particles_at_zlo = 1
ele2.save_particles_at_xhi = 1
ele2.save_particles_at_yhi = 1
ele2.save_particles_at_zhi = 1

pos1.save_particles_at_xlo = 1
pos1.save_particles_at_ylo = 1
pos1.save_particles_at_zlo = 1
pos1.save_particles_at_xhi = 1
pos1.save_particles_at_yhi = 1
pos1.save_particles_at_zhi = 1

# particles inside the simulation domain
particles_in.intervals = 1
particles_in.diag_type = Full
particles_in.species = ele1 pos2
particles_in.fields_to_plot = none
particles_in.format = openpmd
particles_in.openpmd_backend = h5
particles_in.dump_last_timestep = 1

# REDUCED
warpx.reduced_diags_names = DiffLumi_ele1_pos2 DiffLumi_ele1_ele2 DiffLumi_pos1_pos2 DiffLumi_pos1_ele2 DiffLumi_pos1_pho2 DiffLumi_ele1_pho2 DiffLumi_pho1_pos2 DiffLumi_pho1_ele2 DiffLumi_pho1_pho2 CollRel_ele1_pos2

CollRel_ele1_pos2.type = ColliderRelevant
CollRel_ele1_pos2.species = ele1 pos2
CollRel_ele1_pos2.intervals = 1

DiffLumi_ele1_pos2.type = DifferentialLuminosity
DiffLumi_ele1_pos2.intervals = nt
DiffLumi_ele1_pos2.species = ele1 pos2
DiffLumi_ele1_pos2.bin_number = bin_num_1d_eff
DiffLumi_ele1_pos2.bin_max = bin_edge_max_1d
DiffLumi_ele1_pos2.bin_min = bin_edge_min_1d

DiffLumi_ele1_ele2.type = DifferentialLuminosity
DiffLumi_ele1_ele2.intervals = nt
DiffLumi_ele1_ele2.species = ele1 ele2
DiffLumi_ele1_ele2.bin_number = bin_num_1d_eff
DiffLumi_ele1_ele2.bin_max = bin_edge_max_1d
DiffLumi_ele1_ele2.bin_min = bin_edge_min_1d

DiffLumi_pos1_pos2.type = DifferentialLuminosity
DiffLumi_pos1_pos2.intervals = nt
DiffLumi_pos1_pos2.species = pos1 pos2
DiffLumi_pos1_pos2.bin_number = bin_num_1d_eff
DiffLumi_pos1_pos2.bin_max = bin_edge_max_1d
DiffLumi_pos1_pos2.bin_min = bin_edge_min_1d

DiffLumi_pos1_ele2.type = DifferentialLuminosity
DiffLumi_pos1_ele2.intervals = nt
DiffLumi_pos1_ele2.species = pos1 ele2
DiffLumi_pos1_ele2.bin_number = bin_num_1d_eff
DiffLumi_pos1_ele2.bin_max = bin_edge_max_1d
DiffLumi_pos1_ele2.bin_min = bin_edge_min_1d

DiffLumi_ele1_pho2.type = DifferentialLuminosity
DiffLumi_ele1_pho2.intervals = nt
DiffLumi_ele1_pho2.species = ele1 pho2
DiffLumi_ele1_pho2.bin_number = bin_num_1d_eff
DiffLumi_ele1_pho2.bin_max = bin_edge_max_1d
DiffLumi_ele1_pho2.bin_min = bin_edge_min_1d

DiffLumi_pos1_pho2.type = DifferentialLuminosity
DiffLumi_pos1_pho2.intervals = nt
DiffLumi_pos1_pho2.species = pos1 pho2
DiffLumi_pos1_pho2.bin_number = bin_num_1d_eff
DiffLumi_pos1_pho2.bin_max = bin_edge_max_1d
DiffLumi_pos1_pho2.bin_min = bin_edge_min_1d

DiffLumi_pho1_pos2.type = DifferentialLuminosity
DiffLumi_pho1_pos2.intervals = nt
DiffLumi_pho1_pos2.species = pho1 pos2
DiffLumi_pho1_pos2.bin_number = bin_num_1d_eff
DiffLumi_pho1_pos2.bin_max = bin_edge_max_1d
DiffLumi_pho1_pos2.bin_min = bin_edge_min_1d

DiffLumi_pho1_ele2.type = DifferentialLuminosity
DiffLumi_pho1_ele2.intervals = nt
DiffLumi_pho1_ele2.species = pho1 ele2
DiffLumi_pho1_ele2.bin_number = bin_num_1d_eff
DiffLumi_pho1_ele2.bin_max = bin_edge_max_1d
DiffLumi_pho1_ele2.bin_min = bin_edge_min_1d

DiffLumi_pho1_pho2.type = DifferentialLuminosity
DiffLumi_pho1_pho2.intervals = nt
DiffLumi_pho1_pho2.species = pho1 pho2
DiffLumi_pho1_pho2.bin_number = bin_num_1d_eff
DiffLumi_pho1_pho2.bin_max = bin_edge_max_1d
DiffLumi_pho1_pho2.bin_min = bin_edge_min_1d
Some notable details:
Poisson solver: because the beams are ultra-relativistic (125 GeV electrons and positrons) and flat, we use an FFT-based electrostatic solver. Specifically, it solves many 2D Poisson equations in the \((x,y)\) plane for each \(z\). The full 3D version of this solver is also available with
warpx.use_2d_slices_fft_solver = 0.Resolution: the number of grid cells is reduced to fit in a laptop. For production simulations, make sure you increase the resolution.
Timestep: since the beams travel at the speed of light along \(z\) and the simulation frame is the center of mass frame, it makes sense to choose $dt = dz / ( 2 c ) $. However this is not strictly necessary. Sometimes it can be useful to save resources by choosing a larger timestep. Just make sure you resolve ‘’well-enough’’ the shortest timescale that you’re interested in.
QED lookup tables: here we use the built-in ones for convenience. For production runs, make sure to use tables with enough points and set the ranges of the \(\chi\) parameter to what you need.
-
Diagnostics:
- the trajectories of the beam particles. This diagnostic can easily take up too much memory. For simulations with many macroparticles, consider using a field diagnostic.
- all the particles that exit the domain
(
BoundaryScraping) - the differential luminosity of every pair of left-ward and right-ward moving species
Run
First things first. Create a new folder where you copy the input file. The simulation in small enough that you should be able to run it in serial with the Conda installation of WarpX.
If you want to make the simulation faster and/or bigger, then you should run with the parallel version of WarpX. The optimal setup to run the simulation depends on your hardware. This is an example that should work on many common laptops, even though it might not be ideal.
On my laptop’s CPU (12th Gen Intel® Core™ i9-12900H × 20) the serial simulation took ~195 seconds, while the parallel one ~44 seconds on 4 cores!
Visualize
With Python 🐍
Now that we have the results, we can analyze them using Python.
We will use the openPMD-viewer library
to grab the data that the simulation produced in openPMD
format. Here you can find a
few great tutorials on how to use the viewer. If you feel nerdy
and/or you need to deal with the data in parallel workflows, you can use
the openPMD-api.
As an example for the beam-beam simulation, we have developed simple Jupyter notebook where we retrieve the beams’ particles positions and project them on the \((z,x)\) and \((z,y)\) planes.
You can download the notebook and try it yourself. Remember to either run the notebook from the simulation directory or change the corresponding path in the notebook.
With Paraview
Coming soon!
💅 There are several details one needs to take care when setting up a beam-beam simulation
🔍 The documentation is the first place to look for answers, otherwise check out our issues and discussions and ask there.
📷 To analyze and visualize the simulation results in openPMD format, you can use the openPMD-viewer library for Python.
Content from OSSFE 2025 - Using WarpX, a general purpose particle-in-cell code
Last updated on 2026-04-08 | Edit this page
Estimated time: 60 minutes
Overview
Questions
- 🤌 What is WarpX?
- 🔧 How can I install and run WarpX?
- 🕵️ How can I analyze the simulation results?
Objectives
- 💻 Install WarpX on your local machine with Conda
- 🏃 Run a fusion-relevant example on your local machine: protons in a magnetic mirror!
- 👀 Visualize the results with
PythonandParaview
WarpX, a particle-in-cell code
Welcome to the WarpX tutorial at OSSFE 2025 (March 18, 2025)! 👋
WarpX is a general purpose
open-source high-performance
Particle-In-Cell (PIC) code.
If you are not familiar with the PIC method, here is a picture that
condenses the core idea:
And here is a more informative image that explains the core algorithmic steps.
If you want to know more about PIC, here are a few references:
- The two bibles on PIC 📚
- An old review written by one of the pioneers: John M. Dawson,
Particle simulation of plasmas, Rev. Mod. Phys. 55, 403
- Browse our docs for many more references about advanced algorithms and methods.
In this tutorial we will go through the basics of WarpX: installation, running a simple example and visualizing the results. Along the way, we will point to some specific locations in the documentation, for your reference.
Some cool features of WarpX:
📖 Open-source - we wouldn’t be here otherwise!
✈️ Runs on GPUs: NVIDIA, AMD, and Intel
🚀 Runs on multiple GPUs or CPUs, on systems ranging from laptops to supercomputers
🤓 Many many advanced algorithms and methods: mesh-refinement, embedded boundaries, electrostatic/electromagnetic/pseudospectral solvers, etc.
💾 Standards: openPMD for input/output data, PICMI for inputs
🤸 Active development and mainteinance: check our GitHub repo
🗺️ International, cross-disciplinary community: plasma physics, fusion devices, laser-plasma interactions, beam physics, plasma-based acceleration, astrophysics
Installing WarpX using Conda-Forge
First, you need a Conda installation and we will
assume that you indeed have one.
If not, follow the instruction
at this link.
You can install Conda on most operative systems: Windows, macOS,
and Linux.
We will also assume you have some familiarity with the
terminal. Once you have Conda on your system,
WarpX is available as a package via Conda-Forge.
The installation is a one-liner 😌!
Ok, maybe two lines if you want to keep your system clean by creating a new environment.
Now you should have 4 different WarpX binaries in your
PATH called warpx.1d, warpx.2d,
warpx.3d, warpx.rz.
Each binary for a different dimensionality.
To check this, run:
If you get 3 different paths that look something like:
then you got this 🙌! You can also import pywarpx in
Python.
A simple example of a magnetic mirror
In this example we will simulate a bunch of protons inside a
magnetic mirror machine. The protons are initialized with
random positions and velocities. The magnetic field is loaded from a
.h5 file. Make sure to download the input file.
Whenever you need to prepare an input file, this is where you want to go. By the way, analytics tell us that this is the most popular page of the documentation 👠!
OUTPUT
##########################
# USER-DEFINED CONSTANTS #
##########################
my_constants.Lx = 2 # [m]
my_constants.Ly = 2 # [m]
my_constants.Lz = 5 # [m]
my_constants.dt = 4.4e-7 # [s]
my_constants.Np = 1000

############
# NUMERICS #
############
geometry.dims = 3
geometry.prob_hi =  0.5*Lx  0.5*Ly Lz
geometry.prob_lo = -0.5*Lx -0.5*Ly 0
amr.n_cell = 40 40 40
max_step = 500
warpx.const_dt = dt

##############
# ALGORITHMS #
##############
algo.particle_shape = 1
amr.max_level = 0
warpx.do_electrostatic = labframe
warpx.grid_type = collocated
warpx.serialize_initial_conditions = 0
warpx.use_filter = 0

##############
# BOUNDARIES #
##############
boundary.field_hi = pec pec pec
boundary.field_lo = pec pec pec
boundary.particle_hi = absorbing absorbing absorbing
boundary.particle_lo = absorbing absorbing absorbing

#############
# PARTICLES #
#############
particles.species_names = protons
protons.charge = q_e
protons.mass = m_p
protons.do_not_deposit = 1 # test particles
protons.initialize_self_fields = 0
protons.injection_style = gaussian_beam
protons.x_rms = 0.1*Lx
protons.y_rms = 0.1*Ly
protons.z_rms = 0.1*Lz
protons.x_m = 0.
protons.y_m = 0.
protons.z_m = 0.5*Lz
protons.npart = Np
protons.q_tot = q_e*Np
protons.momentum_distribution_type = uniform
protons.ux_min = -9.5e-05
protons.uy_min = -9.5e-05
protons.uz_min = -0.000134
protons.ux_max = 9.5e-05
protons.uy_max = 9.5e-05
protons.uz_max = 0.000134

##########
# FIELDS #
##########
# field here is applied on directly the particles!
particles.B_ext_particle_init_style = read_from_file
particles.read_fields_from_path = example-femm-3d.h5

###############
# DIAGNOSTICS #
###############
diagnostics.diags_names = diag1
diag1.diag_type = Full
diag1.fields_to_plot = Bx By Bz
diag1.format = openpmd
diag1.intervals = 1
diag1.proton.variables = ux uy uz w x y z
diag1.species = protons
diag1.write_species = 1
Now that we have an idea of what the input files looks like, let’s
set up our environment. Activate the warpx environment if
you need to. Create a new directory with your own copy of the input
file. Also, don’t forget to download the field file and place
it in the directory where you will run the input.
Let’s run the code
How would you do it? 🤷
You should see a standard output flashing out a lot of info.
At the end, you should find in your folder:
- a subfolder called
diags: here is where the code stored the diagnostics
- a file called
warpx_used_inputs: this is a summary of the inputs that were used to run the simulation
If that’s the case, yey! 💯
If the run went wrong, you may find a Backtrace.0.0 file
which can be useful for debugging purposes. Let me know if the code
fails in any way!
Here we have loaded the field of hte magnetic bottle from a file. You can also you can define an external field analytically.
Data handling and visualizations
With Python 🐍
Now that we have the results, we can analyze them using Python.
We will use the openPMD-viewer library
to grab the data that the simulation produced in openPMD
format. Here you can find a
few great tutorials on how to use the viewer. If you feel nerdy
and/or you need to deal with the data in parallel workflows, you can use
the [openPMD-api][opepmd-api].
As an example for the magnetic bottle simulation, we have developed simple Jupyter notebook where we retrieve the magnetic field and the particle attributes at the end of the simulation. With a little bit more work, we also plot the trajectories of the particles.
You can download the notebook and try it yourself. Remember to either run the notebook from the simulation directory or change the corresponding path in the notebook.
With Paraview
Now it’s time to produce some pretty cool images and videos! 😎 If
you don’t have it, you can download Paraview here. In
the diags/diag1 directory you should find a file named
paraview.pmd: Paraview can read .pmd files.
Just open Paraview and from there open the .pmd file. You
should see Meshes and Particles in your
pipeline browser (usually on the left). We can zhuzh up the pipeline so
that we can visualize the trajectories of the protons in time
This is the pipeline that I have used to produce the visualizations below.
If you make any other 3D visualization with this data, let me know! We can add it here 😉!
And that’s all for now! 👋
🚀 WarpX is a open-source high-performance particle-in-cell code
🎯 WarpX is easy to install via Conda:
conda -c conda-forge warpx
🔍 The documentation is the first place to look for answers, otherwise check out our issues and discussions and ask there.
📷 To analyze and visualize the simulation results in openPMD format, you
can use the openPMD-viewer
library for Python or you can open .pmd files directly in
Paraview.
Content from UCB 2026 -- Two-Stream Instability Live Tutorial
Last updated on 2026-04-08 | Edit this page
Estimated time: 90 minutes
Overview
Questions
Where can I find the material from the live WarpX tutorial (April 8, 2026)?
Objectives
Review the steps we followed during the live tutorial session. Access the input files, notebooks, and visualizations produced in class.
What we did
In this live session, we set up and ran a two-stream instability simulation from scratch using WarpX, following an exploratory approach:
We browsed the WarpX examples on GitHub and picked the uniform plasma example as our starting point.
-
We modified the input file:
- Duplicated the electron species and added opposite drift velocities
(
uz_m) to create two counter-streaming beams. - Defined
my_constants.ntso we could change the number of timesteps in one place. - Introduced a temperature constant
Tand used it to compute the thermal spread:ux_th = sqrt(T/m_e)/clight(and same foruy_th,uz_th). For an isotropic distribution, the temperature is the same in each direction: \(T = T_x = T_y = T_z\), and each component of the thermal spread is set independently. - Switched diagnostics to openPMD format so we could use openPMD-viewer to grab the data.
- Duplicated the electron species and added opposite drift velocities
(
We ran the simulation in 2D and made a quick Jupyter notebook to visualize the phase space \((z, u_z)\).
The phase space wasn’t changing – so we increased the number of timesteps.
We kept iterating: set the temperature to zero (cold beams), switched to 1D, increased the resolution and the number of particles per cell.
Eventually, we saw the instability develop: the counter-streaming beams formed vortex structures in phase space.
We made a video of the phase-space evolution.
Reference material
For a detailed walkthrough of the exploratory process we followed in class, see the Set Up a Simulation from Scratch episode.
For a polished version of the two-stream instability simulation, with exercises on parameter selection, reduced diagnostics, and analysis notebooks, see the Two-Stream Instability tutorial.
Files from the session
- Input file used in class
- Jupyter notebook for phase-space visualization and video generation
Video from class
Here is the phase-space video we produced at the end of the session:
As you can see, the dots are too large and it’s hard to see the fine
structure. To improve the visualization, use a smaller marker size in
the scatter plot, e.g. s=0.1. You may also notice that the
instability takes a while to develop – the early frames are not very
interesting.
How can you make the instability grow faster?
Try to think of what controls the growth rate. What parameters could you change so that the instability develops sooner?
A couple of ideas:
Increase the density. The instability growth rate scales with the plasma frequency \(\omega_{pe} \propto \sqrt{n_0}\), so a higher density means faster growth.
Use random particle positions instead of uniform ones. With
NUniformPerCell, the particles start on a regular grid, which is very quiet – the instability has to grow from roundoff-level noise. Switching toNRandomPerCellintroduces more initial noise and can seed the instability earlier. Try changinginjection_stylefromNUniformPerCelltoNRandomPerCellandnum_particles_per_cell_each_dimtonum_particles_per_cell.
Setting up a simulation is an iterative process: start from an existing example, modify, run, visualize, and refine.
The WarpX documentation and the examples gallery are the best starting points.
When things don’t look right, check the basics: enough timesteps, adequate resolution, and appropriate temperature.
Content from US-FCC 2026: Beam-Beam and Tracking Tutorial
Last updated on 2026-09-19 | Edit this page
Estimated time: 0 minutes
Overview
Questions
- How can WarpX, ImpactX, Xsuite, and MAD-X be combined for FCC-ee studies?
- How closely do ImpactX, Xsuite, and MAD-X agree for linear optics?
- How can a WarpX beam-beam interaction be included in a multi-turn simulation with Xsuite?
Objectives
- Set up the software environment used by all three exercises.
- Simulate one FCC-ee bunch crossing with WarpX.
- Compare linear optics through an FCC-ee lattice with ImpactX, Xsuite, and MAD-X.
- Combine a WarpX beam-beam interaction with multi-turn Xsuite tracking.
Overview
Lesson authors: Arianna Formenti (LBNL) and Peter Kicsiny (SLAC).
The three exercises cover different scales of an FCC-ee simulation.
- A single bunch crossing. WarpX models the electromagnetic interaction between an electron bunch and a positron bunch, including several QED processes such as beamstrahlung, radiative Bhabha scattering, and incoherent pair generation.
- An optics comparison. ImpactX, Xsuite, and MAD-X evaluate the same linear FCC-ee lattice with a common reference particle; ImpactX transports a matched beam covariance through it.
- Many turns around the ring. Xsuite tracks the bunches around the FCC-ee lattice and WarpX supplies the beam-beam interaction at the collision point.
All three exercises use one Conda environment. Tutorial 1 is designed to run on a laptop in a few minutes. Its numerical resolution is deliberately modest and should not be used as a production setup.
Installation
We assume you have a Conda installation available in your machine. Download the Conda environment file, open a terminal in the directory containing it, and create the environment:
Activate it with:
The environment contains WarpX, ImpactX, Xsuite, MAD-X through CPyMAD, openPMD-viewer, Jupyter, and the Python packages used by the analysis notebooks.
OUTPUT
name: usfcc26-warpx-tutorial
channels:
  - conda-forge
dependencies:
  - python=3.14
  - warpx=26.09
  - impactx=26.09
  - openmpi
  - numpy
  - pandas
  - matplotlib
  - jupyterlab
  - openpmd-viewer
  - pip
  - pip:
      - xsuite
      - cpymad
      - numba
You can use any notebook interface. For example, start Jupyter Lab from the exercise directory with:
When you have finished working, deactivate the environment:
To remove it completely at a later date, run:
Tutorial 1: One FCC-ee bunch crossing with WarpX
What we will simulate
At the FCC-ee Z pole, a 45.6 GeV electron bunch collides with a 45.6 GeV positron bunch at a full crossing angle of 30 mrad. The bunches are flat, with an rms size of about 8 micrometers horizontally and 35 nanometers vertically at the interaction point. The bunches are 16 mm long.
WarpX computes the beam-beam fields and advances both bunches through the collision. The same simulation also generates beamstrahlung photons, radiative Bhabha photons, and incoherent electron-positron pairs.
Download the files
Create a directory for Tutorial 1 and place all of the following files in it:
The notebook and utility module must remain in the same directory as the input file.
Read the input file
The input
file is split into constants, numerical settings, particle species,
collision processes, and diagnostics. Values defined under
my_constants can be reused throughout the rest of the
file.
OUTPUT
####################
### MY CONSTANTS ###
####################
my_constants.mc2   = m_e*clight*clight
my_constants.GeV   = q_e*1.e9
my_constants.pico  = 1.e-12
my_constants.nano  = 1.e-9
my_constants.micro = 1.e-6
my_constants.milli = 1.e-3

# BEAMS
my_constants.energy         = 45.6*GeV
my_constants.energy_eV      = energy / q_e
my_constants.gamma          = energy / mc2
my_constants.npart          = 20.20e10
my_constants.nmacropart     = 1e5
my_constants.charge         = q_e * npart
my_constants.betax          = 90*milli
my_constants.betay          = 0.7*milli
my_constants.sigmax         = 7993.75*nano
my_constants.sigmay         = 35.20*nano
my_constants.emitx          = sigmax*sigmax / betax
my_constants.emity          = sigmay*sigmay / betay
my_constants.emitx_n        = emitx * gamma
my_constants.emity_n        = emity * gamma
my_constants.sigmaz         = 16.7*milli
my_constants.dux            = emitx_n / sigmax
my_constants.duy            = emity_n / sigmay
my_constants.espread        = 1.34e-3 * gamma
my_constants.mux            = 0.0*sigmax
my_constants.muy            = 0.0*sigmay
my_constants.muz            = 0.25*Lz
my_constants.focal_distance = muz
my_constants.crossing_angle = 30e-3
my_constants.rotation_angle = 0.5*crossing_angle
my_constants.sigmax_init    = sigmax*sqrt(1 + (muz/betax)**2)
my_constants.sigmay_init    = sigmay*sqrt(1 + (muz/betay)**2)

# BOX
my_constants.Lx = 8*( sigmax_init*cos(rotation_angle) + sigmaz*sin(rotation_angle) )
my_constants.Ly = 8*sigmay_init
my_constants.Lz = 16*sigmaz*cos(rotation_angle)
my_constants.nx = 64    # 512
my_constants.ny = 64    # 2048
my_constants.nz = 128   # 512
my_constants.dx = Lx/nx
my_constants.dy = Ly/ny
my_constants.dz = Lz/nz

# TIME
my_constants.T = 0.5*Lz/clight
my_constants.dt = T / nz
my_constants.nt = floor(T/dt)

# VIRTUAL PHOTONS
# minimum energy
my_constants.hwmin = 1e-4 * mc2 * mc2 / energy

# COLLISIONS
my_constants.sigma_kn_max = 6.65e-29 # m^2, maximum total Compton cross section (Klein-Nishina)
my_constants.sigma_bw_max = 1.7e-29 # m^2, maximum total Breit-Wheeler  cross section
my_constants.probability_estimate =   npart / nmacropart * sigma_bw_max * 2 * clight * dt  / (dx * dy * dz)
my_constants.probability_target_value = 0.01 # we want the event to have this probability
my_constants.multiplier_bw = probability_target_value / probability_estimate
my_constants.probability_threshold = 0.1
# The sampling probability scales as cross section times event multiplier.
# Reduce the Klein-Nishina multiplier so its approximate maximum probability
# matches the Breit-Wheeler target used above.
my_constants.multiplier_kn = sigma_bw_max / sigma_kn_max * multiplier_bw

# DIAGNOSTICS
my_constants.bin_num_1d = 512
my_constants.bin_center_min_1d = 0.
my_constants.bin_center_max_1d = 2.1*energy_eV
my_constants.bin_size_1d = (bin_center_max_1d - bin_center_min_1d) / bin_num_1d
my_constants.bin_edge_min_1d = bin_center_min_1d - 0.5 * bin_size_1d
my_constants.bin_edge_max_1d = bin_center_max_1d + 0.5 * bin_size_1d
my_constants.bin_num_1d_eff = bin_num_1d + 1
warpx.used_inputs_file = warpx_used_inputs.txt

##########################
### GENERAL PARAMETERS ###
##########################
stop_time = T
amr.n_cell = nx ny nz
amr.max_level = 0
geometry.dims = 3
geometry.prob_lo = -0.5*Lx -0.5*Ly -0.5*Lz
geometry.prob_hi =  0.5*Lx  0.5*Ly  0.5*Lz

###########################
### BOUNDARY CONDITIONS ###
###########################
boundary.field_lo = open open open
boundary.field_hi = open open open
boundary.particle_lo = Absorbing Absorbing Absorbing
boundary.particle_hi = Absorbing Absorbing Absorbing

################
### NUMERICS ###
################
warpx.do_electrostatic = relativistic
warpx.const_dt = dt
warpx.grid_type = collocated
algo.particle_shape = 3
algo.particle_pusher = vay
warpx.poisson_solver = fft
warpx.use_2d_slices_fft_solver = 1
warpx.random_seed = 20260908

#################
### PARTICLES ###
#################
particles.species_names = beam1 beam2 pho1 pho2 ele_bh pos_bh ele_bw pos_bw ele_ll pos_ll vpho1 vpho2 pho1_bha pho2_bha beam1_bha beam2_bha test1 test2

# Beams
beam1.species_type = electron
beam1.injection_style = gaussian_beam
beam1.x_rms = sigmax
beam1.y_rms = sigmay
beam1.z_rms = sigmaz
beam1.x_m = - mux
beam1.y_m = - muy
beam1.z_m = - muz
beam1.npart = nmacropart
beam1.q_tot = -charge
beam1.focal_distance = focal_distance
beam1.do_gaussian_beam_rotation = 1
beam1.do_gaussian_beam_rotation_momenta = 0
beam1.gaussian_beam_rotation_angle = rotation_angle
beam1.gaussian_beam_rotation_axis = 0 1 0
beam1.momentum_distribution_type = gaussian
beam1.uz_m = gamma
beam1.uy_m = 0.0
beam1.ux_m = 0.0
beam1.ux_th = dux
beam1.uy_th = duy
beam1.uz_th = espread
beam1.initialize_self_fields = 1
beam1.do_qed_quantum_sync = 1 # BS
beam1.qed_quantum_sync_phot_product_species = pho1
beam1.do_classical_radiation_reaction = 0
beam1.do_qed_virtual_photons = 1
# Keep the baseline consistent with the analytical Bhabha comparison, which
# neglects the finite beam-size effect. Set this and the beam2 flag to 1 for a
# separate finite-beam-size study.
beam1.qed_virtual_photons_do_beam_size_effect = 0
beam1.qed_virtual_photon_species_name = vpho1

beam2.species_type = positron
beam2.injection_style = gaussian_beam
beam2.x_rms = sigmax
beam2.y_rms = sigmay
beam2.z_rms = sigmaz
beam2.x_m = mux
beam2.y_m = muy
beam2.z_m = muz
beam2.npart = nmacropart
beam2.q_tot = charge
beam2.focal_distance = focal_distance
beam2.do_gaussian_beam_rotation = 1
beam2.do_gaussian_beam_rotation_momenta = 0
beam2.gaussian_beam_rotation_angle = -rotation_angle
beam2.gaussian_beam_rotation_axis = 0 1 0
beam2.momentum_distribution_type = gaussian
beam2.uz_m = -gamma
beam2.uy_m = 0.0
beam2.ux_m = 0.0
beam2.ux_th = dux
beam2.uy_th = duy
beam2.uz_th = espread
beam2.initialize_self_fields = 1
beam2.do_qed_quantum_sync = 1
beam2.qed_quantum_sync_phot_product_species = pho2
beam2.do_classical_radiation_reaction = 0
beam2.do_qed_virtual_photons = 1
beam2.qed_virtual_photons_do_beam_size_effect = 0
beam2.qed_virtual_photon_species_name = vpho2

# Test particles
test1.species_type = electron
test1.injection_style = gaussian_beam
test1.x_rms = sigmax
test1.y_rms = sigmay
test1.z_rms = sigmaz
test1.x_m = - mux
test1.y_m = - muy
test1.z_m = - muz
test1.npart = 100
test1.q_tot = -charge
test1.focal_distance = focal_distance
test1.do_gaussian_beam_rotation = 1
test1.do_gaussian_beam_rotation_momenta = 0
test1.gaussian_beam_rotation_angle = rotation_angle
test1.gaussian_beam_rotation_axis = 0 1 0
test1.momentum_distribution_type = gaussian
test1.uz_m = gamma
test1.uy_m = 0.0
test1.ux_m = 0.0
test1.ux_th = dux
test1.uy_th = duy
test1.uz_th = espread
test1.do_not_deposit = 1

test2.species_type = positron
test2.injection_style = gaussian_beam
test2.x_rms = sigmax
test2.y_rms = sigmay
test2.z_rms = sigmaz
test2.x_m = mux
test2.y_m = muy
test2.z_m = muz
test2.npart = 100
test2.q_tot = charge
test2.focal_distance = focal_distance
test2.do_gaussian_beam_rotation = 1
test2.do_gaussian_beam_rotation_momenta = 0
test2.gaussian_beam_rotation_angle = -rotation_angle
test2.gaussian_beam_rotation_axis = 0 1 0
test2.momentum_distribution_type = gaussian
test2.uz_m = -gamma
test2.uy_m = 0.0
test2.ux_m = 0.0
test2.ux_th = dux
test2.uy_th = duy
test2.uz_th = espread
test2.do_not_deposit = 1

# Beamstrahlung photons
pho1.species_type = photon
pho1.injection_style = none

pho2.species_type = photon
pho2.injection_style = none

# Virtual photons
vpho1.qed_virtual_photons_min_energy = hwmin
vpho1.qed_virtual_photons_multiplier = 1
vpho1.species_type = photon
vpho1.injection_style = none
vpho1.do_not_push = 1

vpho2.qed_virtual_photons_min_energy = hwmin
vpho2.qed_virtual_photons_multiplier = 1
vpho2.species_type = photon
vpho2.injection_style = none
vpho2.do_not_push = 1

# Incoherent pairs
ele_bw.species_type = electron
ele_bw.injection_style = none
ele_bw.do_not_deposit = 1

pos_bw.species_type = positron
pos_bw.injection_style = none
pos_bw.do_not_deposit = 1

ele_ll.species_type = electron
ele_ll.injection_style = none
ele_ll.do_not_deposit = 1

pos_ll.species_type = positron
pos_ll.injection_style = none
pos_ll.do_not_deposit = 1

ele_bh.species_type = electron
ele_bh.injection_style = none
ele_bh.do_not_deposit = 1

pos_bh.species_type = positron
pos_bh.injection_style = none
pos_bh.do_not_deposit = 1

# Bhabha photons
pho1_bha.species_type = photon
pho1_bha.injection_style = none
pho1_bha.do_qed_breit_wheeler = 0

pho2_bha.species_type = photon
pho2_bha.injection_style = none
pho2_bha.do_qed_breit_wheeler = 0

# Backscattered beam particles
beam1_bha.species_type = electron
beam1_bha.injection_style = none
beam1_bha.do_not_deposit = 1

beam2_bha.species_type = positron
beam2_bha.injection_style = none
beam2_bha.do_not_deposit = 1

##############
### SF-QED ###
##############

qed_qs.photon_creation_energy_threshold = 0.

qed_qs.lookup_table_mode = builtin
qed_qs.chi_min = 1.e-8

warpx.do_qed_schwinger = 0.

##################
### COLLISIONS ###
##################
collisions.collision_names = ll bh1 bh2 lbw bhabha1 bhabha2

lbw.species = pho1 pho2
lbw.type = linear_breit_wheeler
lbw.product_species = ele_bw pos_bw
lbw.event_multiplier = multiplier_bw
lbw.probability_threshold = probability_threshold
lbw.probability_target_value = probability_target_value

ll.species = vpho1 vpho2
ll.type = linear_breit_wheeler
ll.product_species = ele_ll pos_ll
ll.event_multiplier = multiplier_bw
ll.probability_threshold = probability_threshold
ll.probability_target_value = probability_target_value

bh1.species = vpho1 pho2
bh1.type = linear_breit_wheeler
bh1.product_species = ele_bh pos_bh
bh1.event_multiplier = multiplier_bw
bh1.probability_threshold = probability_threshold
bh1.probability_target_value = probability_target_value

bh2.species = pho1 vpho2
bh2.type = linear_breit_wheeler
bh2.product_species = ele_bh pos_bh
bh2.event_multiplier = multiplier_bw
bh2.probability_threshold = probability_threshold
bh2.probability_target_value = probability_target_value

bhabha1.species = vpho2 beam1
bhabha1.type = linear_compton
bhabha1.product_species = pho1_bha beam1_bha
bhabha1.event_multiplier = multiplier_kn
bhabha1.probability_threshold = probability_threshold
bhabha1.probability_target_value = probability_target_value

bhabha2.species = vpho1 beam2
bhabha2.type = linear_compton
bhabha2.product_species = pho2_bha beam2_bha
bhabha2.event_multiplier = multiplier_kn
bhabha2.probability_threshold = probability_threshold
bhabha2.probability_target_value = probability_target_value

###################
### DIAGNOSTICS ###
###################
# These will contain per particle coordinates, momenta and weights
diagnostics.diags_names = particles_in particles_out trajectories

trajectories.intervals = 1
trajectories.write_species = 1
trajectories.diag_type = Full
trajectories.species = test1 test2
trajectories.fields_to_plot = none
trajectories.format = openpmd
trajectories.openpmd_backend = bp
trajectories.dump_last_timestep = 1
trajectories.test1.additional_variables = Ex Ey Ez Bx By Bz
trajectories.test2.additional_variables = Ex Ey Ez Bx By Bz

particles_in.intervals = floor(nz/4)
particles_in.write_species = 1
particles_in.diag_type = Full
particles_in.species = beam1 beam2 pho1 pho2 ele_bh pos_bh ele_bw pos_bw ele_ll pos_ll pho1_bha pho2_bha beam1_bha beam2_bha
particles_in.fields_to_plot = none
particles_in.format = openpmd
particles_in.openpmd_backend = bp
particles_in.dump_last_timestep = 1

particles_out.intervals = -1
particles_out.diag_type = BoundaryScraping
particles_out.format = openpmd
particles_out.openpmd_backend = bp
particles_out.dump_last_timestep = 1

beam1.save_particles_at_xlo = 1
beam1.save_particles_at_ylo = 1
beam1.save_particles_at_zlo = 1
beam1.save_particles_at_xhi = 1
beam1.save_particles_at_yhi = 1
beam1.save_particles_at_zhi = 1

beam2.save_particles_at_xlo = 1
beam2.save_particles_at_ylo = 1
beam2.save_particles_at_zlo = 1
beam2.save_particles_at_xhi = 1
beam2.save_particles_at_yhi = 1
beam2.save_particles_at_zhi = 1

pho1.save_particles_at_xlo = 1
pho1.save_particles_at_ylo = 1
pho1.save_particles_at_zlo = 1
pho1.save_particles_at_xhi = 1
pho1.save_particles_at_yhi = 1
pho1.save_particles_at_zhi = 1

pho2.save_particles_at_xlo = 1
pho2.save_particles_at_ylo = 1
pho2.save_particles_at_zlo = 1
pho2.save_particles_at_xhi = 1
pho2.save_particles_at_yhi = 1
pho2.save_particles_at_zhi = 1

ele_ll.save_particles_at_xlo = 1
ele_ll.save_particles_at_ylo = 1
ele_ll.save_particles_at_zlo = 1
ele_ll.save_particles_at_xhi = 1
ele_ll.save_particles_at_yhi = 1
ele_ll.save_particles_at_zhi = 1

pos_ll.save_particles_at_xlo = 1
pos_ll.save_particles_at_ylo = 1
pos_ll.save_particles_at_zlo = 1
pos_ll.save_particles_at_xhi = 1
pos_ll.save_particles_at_yhi = 1
pos_ll.save_particles_at_zhi = 1

ele_bh.save_particles_at_xlo = 1
ele_bh.save_particles_at_ylo = 1
ele_bh.save_particles_at_zlo = 1
ele_bh.save_particles_at_xhi = 1
ele_bh.save_particles_at_yhi = 1
ele_bh.save_particles_at_zhi = 1

pos_bh.save_particles_at_xlo = 1
pos_bh.save_particles_at_ylo = 1
pos_bh.save_particles_at_zlo = 1
pos_bh.save_particles_at_xhi = 1
pos_bh.save_particles_at_yhi = 1
pos_bh.save_particles_at_zhi = 1

ele_bw.save_particles_at_xlo = 1
ele_bw.save_particles_at_ylo = 1
ele_bw.save_particles_at_zlo = 1
ele_bw.save_particles_at_xhi = 1
ele_bw.save_particles_at_yhi = 1
ele_bw.save_particles_at_zhi = 1

pos_bw.save_particles_at_xlo = 1
pos_bw.save_particles_at_ylo = 1
pos_bw.save_particles_at_zlo = 1
pos_bw.save_particles_at_xhi = 1
pos_bw.save_particles_at_yhi = 1
pos_bw.save_particles_at_zhi = 1

pho1_bha.save_particles_at_xlo = 1
pho1_bha.save_particles_at_ylo = 1
pho1_bha.save_particles_at_zlo = 1
pho1_bha.save_particles_at_xhi = 1
pho1_bha.save_particles_at_yhi = 1
pho1_bha.save_particles_at_zhi = 1

pho2_bha.save_particles_at_xlo = 1
pho2_bha.save_particles_at_ylo = 1
pho2_bha.save_particles_at_zlo = 1
pho2_bha.save_particles_at_xhi = 1
pho2_bha.save_particles_at_yhi = 1
pho2_bha.save_particles_at_zhi = 1

beam1_bha.save_particles_at_xlo = 1
beam1_bha.save_particles_at_ylo = 1
beam1_bha.save_particles_at_zlo = 1
beam1_bha.save_particles_at_xhi = 1
beam1_bha.save_particles_at_yhi = 1
beam1_bha.save_particles_at_zhi = 1

beam2_bha.save_particles_at_xlo = 1
beam2_bha.save_particles_at_ylo = 1
beam2_bha.save_particles_at_zlo = 1
beam2_bha.save_particles_at_xhi = 1
beam2_bha.save_particles_at_yhi = 1
beam2_bha.save_particles_at_zhi = 1

# REDUCED
warpx.reduced_diags_names = DiffLumi_beam1_beam2 ColliderRelevant

DiffLumi_beam1_beam2.type = DifferentialLuminosity
DiffLumi_beam1_beam2.intervals = nt
DiffLumi_beam1_beam2.species = beam1 beam2
DiffLumi_beam1_beam2.bin_number = bin_num_1d_eff
DiffLumi_beam1_beam2.bin_max = bin_edge_max_1d
DiffLumi_beam1_beam2.bin_min = bin_edge_min_1d

ColliderRelevant.species = beam1 beam2
ColliderRelevant.type = ColliderRelevant
The laptop setup uses:
-
100000macroparticles in each primary bunch -
100passive test particles for each beam - a
64 x 64 x 128mesh -
128time steps - a two-dimensional-slices FFT Poisson solver
- the built-in quantum-synchrotron lookup table
- a fixed random seed for reproducibility
The mesh is much coarser than a production FCC-ee simulation. It is sufficient for learning the workflow and recovering the main features of the collision. The built-in QED table also keeps the download small but has low resolution. A quantitative physics study would require a higher-resolution QED table, together with mesh and macroparticle convergence scans.
The Conda Forge WarpX package used by this lesson includes QED
support and the built-in tables, but it does not currently install the
standalone qed_table_generator executable. To generate a
higher-resolution table, build WarpX from source with
WarpX_QED_TOOLS=ON, following the WarpX
QED table-tool instructions. The resulting
qed_table_generator can create a quantum-synchrotron table
that WarpX reads with qed_qs.lookup_table_mode = load and
qed_qs.load_table_from = /path/to/table.
The primary species and their main products are:
| Species | Role |
|---|---|
beam1, beam2
|
Initial electron and positron bunches |
test1, test2
|
Passive electron and positron probes used for trajectories |
pho1, pho2
|
Beamstrahlung photons emitted by the two bunches |
vpho1, vpho2
|
Virtual photons used by the equivalent-photon model |
ele_ll, pos_ll
|
Landau-Lifshitz pair products |
ele_bh, pos_bh
|
Breit-Heitler pair products |
ele_bw, pos_bw
|
Breit-Wheeler pair products |
pho1_bha, pho2_bha
|
Photons from radiative Bhabha scattering |
beam1_bha, beam2_bha
|
Scattered primary particles from Bhabha events |
Beamstrahlung is enabled directly on each primary beam through the
strong-field QED modules. The finite beam-size correction in the
equivalent-photon model is disabled in the baseline input. This makes
the radiative Bhabha result consistent with the analytical comparison
below, which also neglects that correction; it does not disable
beamstrahlung. To study finite-beam-size suppression, set
qed_virtual_photons_do_beam_size_effect = 1 for both
primary beams and run the modified input in a separate directory so that
the baseline diagnostics are retained. The incoherent-pair and radiative
Bhabha channels are listed in collisions.collision_names.
Event multipliers increase the number of sampled rare events, while
particle weights preserve the physical yield. Because the sampling
probability scales with cross section times event multiplier, the
Klein–Nishina multiplier is reduced by
sigma_bw_max / sigma_kn_max relative to the Breit–Wheeler
multiplier. This keeps their approximate maximum sampling probabilities
near the same target.
Notice that the radiative Bhabha products are stored in new species. This makes the emitted photons and scattered primary particles easy to analyze without mixing them into the original bunch species.
Diagnostics
The simulation writes three openPMD particle diagnostics:
-
diags/particles_incontains snapshots of particles that are still inside the simulation domain -
diags/particles_outrecords particles when they cross a domain boundary -
diags/trajectoriesrecords the two test-particle species at every time step
The test species start with the same distributions as the primary
beams, but do_not_deposit = 1 prevents their charge and
current from contributing to the field solve. They respond to the
self-consistent beam-beam fields without changing those fields, making
them useful single-particle probes.
The ColliderRelevant and
DifferentialLuminosity reduced diagnostics are written to
diags/reducedfiles.
The analysis utility module combines the particles that remain in the box with the boundary records. For escaped particles, it reconstructs their positions at the final simulation time from their scrape time and momentum:
\[ \boldsymbol{x}(t_{\mathrm{final}}) =\boldsymbol{x}(t_{\mathrm{scrape}}) +\boldsymbol{v}\left(t_{\mathrm{final}}-t_{\mathrm{scrape}}\right). \]
For photons, \(\boldsymbol{v}=c\boldsymbol{p}/|\boldsymbol{p}|\). For massive particles, the utility obtains the velocity from \(\boldsymbol{v}=\boldsymbol{p}/(\gamma m_e)\). This reconstruction lets the later spectrum and pair plots include products that have already left the mesh instead of silently discarding them.
Run WarpX
Activate the tutorial environment, change to the directory containing the three downloaded files, and run:
On the laptop used to prepare this tutorial, the run takes about three to four minutes and produces roughly 80 MB of diagnostics. Runtime will vary with the processor and storage system.
When the run finishes, your directory should contain:
tutorial_1_input.txt
tutorial_1_plots.ipynb
tutorial_1_utils.py
diags/
warpx_used_inputs.txt
warpx_used_inputs.txt is generated by WarpX. It records
the fully evaluated input and is useful when an input value is defined
through an expression.
Analyze the collision
Open the
analysis notebook with your preferred Jupyter interface and run the
cells in order. The notebook expects the diags directory in
the current Tutorial 1 directory.
The utility module contains the routines used to read particle data, reconstruct boundary particles, integrate the hourglass luminosity, and calculate the radiative Bhabha cross section and lifetime.
OUTPUT
import os
import re
import warnings

import numpy as np
from openpmd_viewer import OpenPMDTimeSeries
from scipy.constants import c, e, m_e
from scipy.integrate import quad, trapezoid


def extract_macroparticles(species_list, sim_folder=".", diags_name="diags", step=-1):
    """
    Read WarpX coordinates located at 'sim_folder' in 'diags_name'
    corresponding to simulation timestep 'step'.
    """
    x_list = []
    y_list = []
    z_list = []
    w_list = []
    ux_list = []
    uy_list = []
    uz_list = []

    if step==-1:
        folder_list = [
            diags_name+'/particles_in',
            diags_name+'/particles_out/particles_at_xlo',
            diags_name+'/particles_out/particles_at_xhi',
            diags_name+'/particles_out/particles_at_ylo',
            diags_name+'/particles_out/particles_at_yhi',
            diags_name+'/particles_out/particles_at_zlo',
            diags_name+'/particles_out/particles_at_zhi',
            ]
    else:
        folder_list = [ diags_name+'/particles_in', ]
    # Loop through the files that contain particles collected at the edges and in the box
    for folder_name in folder_list:
        read_dir = os.path.join(sim_folder, folder_name)
        if os.path.isdir(read_dir):
            series = OpenPMDTimeSeries(read_dir)
            time = series.t[step]
            iteration = series.iterations[step]
            dt =  series.t[-1] / series.iterations[-1]

            for species in species_list:
                x, y, z, ux, uy, uz, w = series.get_particle( ['x', 'y', 'z', 'ux', 'uy', 'uz', 'w'], iteration=iteration, species=species )

                if ("particles_at" in folder_name):
                    it_scrape, = series.get_particle( ['stepScraped', ], iteration=iteration, species=species )
                    t_scrape = it_scrape * dt

                    momentum_squared = ux**2 + uy**2 + uz**2
                    if "pho" in species:
                        momentum_magnitude = np.sqrt(momentum_squared)
                        vx = c * ux / momentum_magnitude
                        vy = c * uy / momentum_magnitude
                        vz = c * uz / momentum_magnitude
                    else:
                        gamma = np.sqrt(1.0 + momentum_squared / (m_e * c) ** 2)
                        vx = ux / (gamma * m_e)
                        vy = uy / (gamma * m_e)
                        vz = uz / (gamma * m_e)

                    time_since_scrape = time - t_scrape
                    x = x + vx * time_since_scrape
                    y = y + vy * time_since_scrape
                    z = z + vz * time_since_scrape

                # convert from SI [kg m s-1] to [eV/c]
                conversion_factor = c/e

                x_list=np.append(x_list, x)
                y_list=np.append(y_list, y)
                z_list=np.append(z_list, z)
                w_list=np.append(w_list, w)
                ux_list=np.append(ux_list, ux * conversion_factor)
                uy_list=np.append(uy_list, uy * conversion_factor)
                uz_list=np.append(uz_list, uz * conversion_factor)

    # x y z [m], ux, uy, uz [eV/c], w=weight (no dimension)
    return np.asarray(x_list), np.asarray(y_list), np.asarray(z_list), np.asarray(ux_list), np.asarray(uy_list), np.asarray(uz_list), np.asarray(w_list)

def get_Ecom(filename):
    """
    Return 1 numpy array:
    - the center-of-mass energy (in eV)
    """
    with open(filename) as f:
        # First line: header, contains the energies
        line = f.readline()
        Ecom = np.array( list(map( float, re.findall('=(.*?)\\(', line) )) )
    return Ecom

def get_dL_dEcom(filename):
    """
    Return the cumulative differential luminosity and its energy integral.

    Returns:
    - the center-of-mass energy [eV]
    - differential luminosity [m^-2 eV^-1]
    - luminosity integrated over center-of-mass energy [m^-2]
    """
    Ecom = get_Ecom(filename)  # eV
    # ``ndmin=2`` also handles a diagnostic containing only its final row.
    values = np.loadtxt(filename, ndmin=2)[-1, 2:]
    if values.size == Ecom.size + 1:
        # Current WarpX appends the total luminosity after the differential
        # energy bins. Keep it out of the plotted spectrum.
        dL_dEcom = values[:-1]  # m^-2 eV^-1
        Ltot = values[-1]  # m^-2
    elif values.size == Ecom.size:
        # Compatibility with older output that omitted the total column.
        warnings.warn(
            "DifferentialLuminosity has no final total-luminosity column; "
            "integrating the energy bins. Check the WarpX version.",
            RuntimeWarning,
            stacklevel=2,
        )
        dL_dEcom = values
        Ltot = trapezoid(dL_dEcom, Ecom)
    else:
        raise ValueError(
            "Unexpected DifferentialLuminosity layout: "
            f"found {values.size} values for {Ecom.size} energy bins"
        )

    return Ecom, dL_dEcom, Ltot


def luminosity_per_bx_hourglass(
    bunch_intensity,
    sigma_x,
    sigma_y,
    sigma_z,
    phi,
    beta_x_star,
    beta_y_star,
    epsabs=0.0,
    epsrel=1.0e-10,
):
    """Return luminosity per bunch crossing, including the hourglass effect.

    This evaluates the longitudinal overlap of two identical Gaussian bunches.
    The transverse beam sizes evolve around the interaction-point waist as
    ``sigma(s) = sigma_star * sqrt(1 + (s / beta_star)**2)``. The crossing
    angle ``phi`` is the half crossing angle.

    Parameters are in SI units (meters and radians); the returned luminosity
    per bunch crossing is in ``m^-2``.
    """
    positive_parameters = {
        "bunch_intensity": bunch_intensity,
        "sigma_x": sigma_x,
        "sigma_y": sigma_y,
        "sigma_z": sigma_z,
        "beta_x_star": beta_x_star,
        "beta_y_star": beta_y_star,
    }
    for name, value in positive_parameters.items():
        if value <= 0.0:
            raise ValueError(f"{name} must be positive, got {value!r}")

    def integrand(s):
        sigma_x_s = sigma_x * np.sqrt(1.0 + (s / beta_x_star) ** 2)
        sigma_y_s = sigma_y * np.sqrt(1.0 + (s / beta_y_star) ** 2)
        longitudinal_overlap = np.exp(-(s / sigma_z) ** 2)
        crossing_angle_reduction = np.exp(-((phi * s) / sigma_x_s) ** 2)
        return longitudinal_overlap * crossing_angle_reduction / (
            sigma_x_s * sigma_y_s
        )

    overlap_integral, _ = quad(
        integrand,
        -np.inf,
        np.inf,
        epsabs=epsabs,
        epsrel=epsrel,
        limit=200,
    )
    normalization = 4.0 * np.pi * np.sqrt(np.pi) * sigma_z
    return bunch_intensity**2 * overlap_integral / normalization


def integrand_qed(y, beam_energy, electron_mass):
    """Return the radiative-Bhabha cross-section integrand.

    ``y`` is the emitted photon's fractional beam energy. ``beam_energy`` and
    ``electron_mass`` must use the same energy unit; the tutorial uses GeV.
    This expression neglects the beam-size effect.
    """
    if not 0.0 < y < 1.0:
        raise ValueError(f"y must lie strictly between 0 and 1, got {y!r}")
    if beam_energy <= 0.0 or electron_mass <= 0.0:
        raise ValueError("beam_energy and electron_mass must be positive")

    photon_spectrum = (4.0 / 3.0 + y**2 - 4.0 * y / 3.0) / y
    logarithmic_factor = (
        2.0 * np.log(4.0 * beam_energy**2 / electron_mass**2)
        + 2.0 * np.log((1.0 - y) / y)
        - 1.0
    )
    return photon_spectrum * logarithmic_factor


def beam_lifetime(
    cross_section,
    luminosity_per_bx,
    bunch_population,
    n_interaction_points,
    revolution_frequency,
    n_bunches=1,
):
    """Return the beam lifetime in hours.

    ``cross_section * luminosity_per_bx`` must be dimensionless. For example,
    use a cross section in mbarn with luminosity converted to mbarn^-1 per
    bunch crossing, as done in the tutorial notebook.
    """
    positive_parameters = {
        "cross_section": cross_section,
        "luminosity_per_bx": luminosity_per_bx,
        "bunch_population": bunch_population,
        "n_interaction_points": n_interaction_points,
        "revolution_frequency": revolution_frequency,
        "n_bunches": n_bunches,
    }
    for name, value in positive_parameters.items():
        if value <= 0.0:
            raise ValueError(f"{name} must be positive, got {value!r}")

    loss_rate = (
        cross_section
        * luminosity_per_bx
        * n_interaction_points
        * revolution_frequency
        * n_bunches
    )
    return bunch_population / loss_rate / 3600.0
What the notebook checks
The notebook does more than plot the output. It turns the particle and reduced diagnostics into beam-physics quantities and, where a compact analytical model is available, compares the simulation with that model. The seven stages below explain what is calculated and what each comparison can tell us.
1. Derived beam parameters
The notebook first reproduces the quantities needed by the later estimates. The relativistic factor and the rms angular divergences at the interaction point are
\[ \gamma=\frac{E_{\mathrm{beam}}}{m_ec^2}, \qquad \sigma_{x'}^*=\frac{\sigma_x^*}{\beta_x^*}, \qquad \sigma_{y'}^*=\frac{\sigma_y^*}{\beta_y^*}. \]
The 30 mrad value in the input is the full crossing angle, so the formulae use the half angle \(\phi=15\) mrad. The Piwinski angle and the corresponding effective horizontal overlap size are
\[ \Phi=\frac{\sigma_z}{\sigma_x^*}\tan\phi, \qquad \sigma_{x,\mathrm{eff}}^*=\sigma_x^*\sqrt{1+\Phi^2}. \]
For the supplied parameters, \(\Phi\simeq31.34\): the crossing angle therefore dominates the effective horizontal overlap.
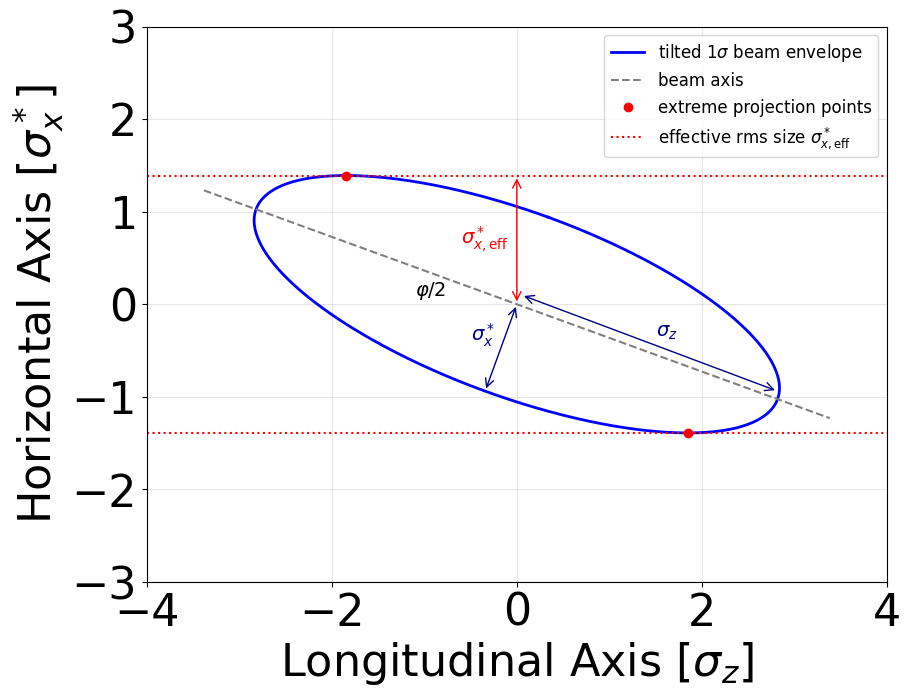
The notebook evaluates the linearized beam-beam parameters
\[ \xi_x=\frac{N_b r_e\beta_x^*} {2\pi\gamma\sigma_{x,\mathrm{eff}}^* \left(\sigma_{x,\mathrm{eff}}^*+\sigma_y^*\right)}, \]
\[ \xi_y=\frac{N_b r_e\beta_y^*} {2\pi\gamma\sigma_y^* \left(\sigma_{x,\mathrm{eff}}^*+\sigma_y^*\right)}, \]
where \(N_b\) is the bunch population and \(r_e\) is the classical electron radius. The resulting values are approximately \(\xi_x=0.0015\) and \(\xi_y=0.0805\).
2. Collision snapshots
At each stored iteration, the notebook plots both primary beams and their beamstrahlung photons in the \((z,x)\) and \((z,y)\) planes. Coordinates are normalized as \(z/\sigma_z\), \(x/\sigma_x^*\), and \(y/\sigma_y^*\) so that the very different horizontal, vertical, and longitudinal scales can be compared in the same figure. These views check the crossing geometry and direction of motion: beam 1 travels toward positive \(z\), beam 2 toward negative \(z\), and the photon products follow the parent beams. Plotting uses a stride for speed; the underlying diagnostic data are not down-sampled.
The notebook next creates one ParticleTracker for
test1 and another for test2. Both trackers
select their particles at the first trajectory output. With
preserve_particle_index=True, a given particle ID retains
the same array index at every later iteration; if a particle is absent,
its entry is filled with NaN instead of shifting all
subsequent trajectories. Plotting each column of the coordinate arrays
therefore traces one physical particle through the collision. The 3D
view shows the full \((z,x,y)\) paths,
while the \((z,x)\) and \((z,y)\) projections make the small
transverse motion easier to read. These passive trajectories reveal the
crossing geometry and accumulated beam-beam deflection without the
sampling noise of the full bunches.
3. Horizontal beam-beam kick
To measure the kick, the notebook selects the beam-1 macroparticles present in the final diagnostic and uses their unique particle IDs to retrieve those same particles from the initial diagnostic. This avoids pairing unrelated rows if the openPMD particle order changes. It then converts momenta into ultrarelativistic trajectory angles,
\[ x'=\frac{p_x}{p_z}, \qquad \Delta x'=x'_{\mathrm{end}}-x'_{\mathrm{start}}. \]
Close to the opposing bunch axis, a Gaussian beam acts like a linear focusing lens:
\[ \Delta x'(x)\simeq-\frac{4\pi\xi_x}{\beta_x^*}x. \]
Because \(\sigma_{x'}^*=\sigma_x^*/\beta_x^*\), normalizing both axes gives a particularly direct test,
\[ \frac{\Delta x'}{\sigma_{x'}^*} \simeq -4\pi\xi_x\frac{x}{\sigma_x^*}. \]
The notebook fits a straight line over \(|x|<10\sigma_x^*\). This wide-looking
interval still samples the central part of the force because \(\sigma_{x,\mathrm{eff}}^*\gg\sigma_x^*\)
for this crossing angle. With the supplied laptop input, the fitted
normalized slope is about -0.0171, while the analytical
slope \(-4\pi\xi_x\) is about
-0.0183, a difference of roughly 7 percent. This tests the
combined field solve and particle push at the chosen resolution. It is
not a convergence test, and it considers only particles that remain in
the domain through the final recorded iteration.
4. Photon spectra and the loss threshold
The helper combines photons still inside the domain with photons found in the boundary-scraping diagnostics. Since openPMD returns momentum in this analysis as eV/\(c\), the photon energy in GeV is calculated from
\[ E_\gamma[\mathrm{GeV}] =10^{-9}\sqrt{p_x^2+p_y^2+p_z^2}. \]
The beamstrahlung and radiative Bhabha histograms are weighted histograms. In an energy bin \(j\), the physical photon yield is
\[ N_{\gamma,j}=\sum_{i\in j}w_i, \]
not the number of macroparticle records. This distinction matters because the rare-event multipliers deliberately create extra sampled events and compensate through the macroparticle weights \(w_i\).
For the Bhabha spectrum, the notebook also marks the energy associated with a 1 percent ring momentum acceptance. If \(\delta_{\mathrm{acc}}=0.01\), a photon is counted as causing the loss of its emitting primary when
\[ E_\gamma>\delta_{\mathrm{acc}}E_{\mathrm{beam}}. \]
This is an approximate loss model: the actual ring acceptance depends on the lattice and on where the off-momentum particle travels.
5. Luminosity and the hourglass effect
The DifferentialLuminosity diagnostic supplies the
cumulative center-of-mass-energy spectrum \(d\mathcal{L}/dE_{\mathrm{com}}\), in m\(^{-2}\) eV\(^{-1}\). In current WarpX output, the last
value on each data row is the total luminosity per bunch crossing,
\[ \mathcal{L}_{E}=\mathcal{L}_{\mathrm{total}}. \]
The utility separates that last value from the preceding energy bins before plotting. For compatibility with an older output layout that omitted the total, it emits a warning and evaluates the numerical energy integral
\[ \mathcal{L}_{E} \simeq\sum_j \left.\frac{d\mathcal{L}}{dE_{\mathrm{com}}}\right|_j\Delta E_j. \]
The ColliderRelevant diagnostic supplies \(d\mathcal{L}/dt\), which gives an
independent estimate through a trapezoidal time integral,
\[ \mathcal{L}_{\mathrm{WarpX}} \simeq\sum_k\frac{1}{2} \left[ \left.\frac{d\mathcal{L}}{dt}\right|_k+ \left.\frac{d\mathcal{L}}{dt}\right|_{k+1} \right](t_{k+1}-t_k). \]
Comparing \(\mathcal{L}_{E}\) with \(\mathcal{L}_{\mathrm{WarpX}}\) first checks the consistency of the two WarpX diagnostics. Their energy and time binning are different, so they are not expected to be bitwise identical; a material difference should prompt checks of the diagnostic binning and numerical resolution.
The first analytical estimate treats the transverse sizes as constant and accounts for the crossing angle only through the effective horizontal size:
\[ \mathcal{L}_0 =\frac{N_b^2}{4\pi\sigma_{x,\mathrm{eff}}^*\sigma_y^*}. \]
FCC-ee has a strong hourglass effect because the beta functions, especially \(\beta_y^*\), are short compared with the bunch length. The utility module therefore also evaluates the longitudinal overlap numerically. At a distance \(s\) from the interaction-point waist,
\[ \sigma_u(s)=\sigma_u^* \sqrt{1+\left(\frac{s}{\beta_u^*}\right)^2}, \qquad u\in\{x,y\}, \]
and the luminosity model used by the notebook is
\[ \mathcal{L}_{\mathrm{HG}} =\frac{N_b^2}{4\pi\sqrt{\pi}\sigma_z} \int_{-\infty}^{\infty} \frac{ \exp\!\left[-(s/\sigma_z)^2\right] \exp\!\left[-(\phi s/\sigma_x(s))^2\right] }{\sigma_x(s)\sigma_y(s)}\,ds. \]
The two exponential factors describe longitudinal bunch overlap and the crossing-angle reduction, respectively. The notebook reports \(\mathcal{L}_{\mathrm{WarpX}}\), \(\mathcal{L}_0\), \(\mathcal{L}_{\mathrm{HG}}\), and the ratio \(\mathcal{L}_{\mathrm{WarpX}}/\mathcal{L}_{\mathrm{HG}}\). At the deliberately coarse laptop resolution, a discrepancy should be interpreted as motivation for mesh, time-step, and macroparticle convergence studies rather than as a precision prediction.
6. Radiative Bhabha cross section and beam lifetime
For each beam, the weighted number of photons above the momentum-acceptance threshold is
\[ N_{\mathrm{loss}}= \sum_{E_{\gamma,i}>\delta_{\mathrm{acc}}E_{\mathrm{beam}}}w_i. \]
Dividing this yield by the simulated luminosity per crossing gives the WarpX cross-section estimate,
\[ \sigma_{\mathrm{Bhabha}}^{\mathrm{WarpX}} =\frac{N_{\mathrm{loss}}}{\mathcal{L}_{\mathrm{WarpX}}}. \]
The notebook compares it with the following QED estimate without the beam-size effect. Defining \(y=E_\gamma/E_{\mathrm{beam}}\) and \(\delta=\delta_{\mathrm{acc}}\),
\[ \sigma_{\mathrm{Bhabha}}^{\mathrm{QED}} =\frac{2\alpha^3}{m_e^2} \int_\delta^1 \frac{4/3+y^2-4y/3}{y} \left[ 2\ln\!\left(\frac{4E_{\mathrm{beam}}^2}{m_e^2}\right) +2\ln\!\left(\frac{1-y}{y}\right)-1 \right]dy. \]
Energies and masses are inserted in GeV, and the result in GeV\(^{-2}\) is converted with \(1\ \mathrm{GeV}^{-2}=0.389\ \mathrm{mbarn}\). Since the finite beam-size correction is disabled in the baseline WarpX input, this is a like-for-like comparison of two calculations that neglect that effect. Residual differences can come from the equivalent-photon and linear-Compton implementation, Monte Carlo statistics, numerical resolution, and the simple loss criterion above. Repeating the WarpX calculation with the correction enabled separately demonstrates its influence.
Finally, the revolution frequency is \(f_{\mathrm{rev}}=c/C\), where \(C\) is the ring circumference. For one bunch, the lifetime inferred from either cross section is
\[ \tau=\frac{N_b} {\sigma_{\mathrm{Bhabha}}\mathcal{L}_{\mathrm{bx}} n_{\mathrm{IP}}f_{\mathrm{rev}}}, \]
with \(n_{\mathrm{IP}}=4\) and \(\mathcal{L}_{\mathrm{bx}}=\mathcal{L}_{\mathrm{WarpX}}\). The notebook reports the electron and positron WarpX estimates and compares the positron result with the QED estimate.
7. Incoherent-pair distributions
The final stage combines the weights and coordinates of the electrons and positrons from the Landau-Lifshitz, Breit-Heitler, and Breit-Wheeler channels. The simulation keeps the colliding beams head-on in momentum space, so the pair momenta are first rotated into the physical crossing-angle frame. Products with \(p_z>0\) are rotated by \(+\phi\) about \(y\), and products with \(p_z<0\) by \(-\phi\). For each rotated momentum it then calculates the polar angle
\[ \theta=\operatorname{atan2} \left(\sqrt{p_x^2+p_y^2},p_z\right), \]
and forms the weighted angular density in bin \(j\),
\[ \left.\frac{dN}{d\theta}\right|_j \simeq\frac{1}{\Delta\theta_j}\sum_{i\in j}w_i. \]
The accompanying \((z,x)\) and \((x,y)\) projections show where the products are located at the final reconstructed time. These are useful first views of potential detector backgrounds, but the three production channels are summed and no detector geometry or transport through the accelerator magnets is included.
The close agreement of one observable does not establish numerical convergence. Increase the mesh resolution and macroparticle count before drawing quantitative conclusions from the QED yields or luminosity.
Tutorial 2: Linear optics comparison
What we will compare
This exercise evaluates one turn of the FCC-ee Z-pole
fccee_p_ring sequence for a 45.6 GeV electron reference
particle with ImpactX, Xsuite, and MAD-X. Rather than including
beam-beam forces, radiation, or space charge, it isolates the
single-particle linear optics. The main observables are the horizontal
and vertical beta functions, \(\beta_x(s)\) and \(\beta_y(s)\), evaluated along the same
lattice.
All three calculations start from fccee_z.madx. This is
important: agreement would be much less meaningful if the codes read
independently maintained versions of the lattice. Create a Tutorial 2
directory containing:
The notebook runs MAD-X through CPyMAD, imports the live MAD-X
sequence into Xsuite, reads the ImpactX diagnostic, and compares all
three results. The first run saves the converted Xsuite line as
fccee_p_ring.json; later runs load this file instead of
repeating the conversion. Keep the three supplied files together and
execute them from that directory.
The matched beam model
At the interaction point, the geometric transverse emittances are constructed from the nominal rms sizes and beta functions,
\[ \varepsilon_x=\frac{(\sigma_x^*)^2}{\beta_x^*}, \qquad \varepsilon_y=\frac{(\sigma_y^*)^2}{\beta_y^*}. \]
For either transverse plane \(u\), the matched covariance matrix has the Twiss form
\[ \Sigma_u=\varepsilon_u \begin{pmatrix} \beta_u & -\alpha_u\\ -\alpha_u & \gamma_u \end{pmatrix}, \qquad \gamma_u=\frac{1+\alpha_u^2}{\beta_u}. \]
The dispersive part of the horizontal beam size is included through the MAD-X dispersion. For an rms relative momentum spread \(\sigma_\delta\),
\[ \sigma_x^2=\varepsilon_x\beta_x+(D_x\sigma_\delta)^2. \]
The script initializes ImpactX with the matched \(\beta\), \(\alpha\), \(D\), and \(D'\) values at the beginning of the sequence. For the longitudinal plane it uses
\[ \varepsilon_t=\sigma_z\sigma_\delta, \qquad \beta_t=\frac{\sigma_z}{\sigma_\delta}. \]
These definitions ensure that a disagreement later in the ring is testing the lattice translation and transport maps, rather than an intentionally mismatched initial beam.
Run the ImpactX calculation
Activate the common tutorial environment, change to the Tutorial 2 directory, and run:
The tested script uses envelope tracking by default:
ImpactX propagates the covariance matrix instead of sampling it with
macroparticles. This removes Monte Carlo noise from the comparison and
is much faster than tracking the script’s configured \(10^7\) macroparticles. Space charge is
disabled, the lattice is loaded from fccee_z.madx with one
slice per element, and slice_step_diagnostics = True
records the beam parameters along the ring.
After a successful run, the file used by the notebook is:
diags/reduced_beam_characteristics.0.0It contains \(s\), beam sizes, emittances, Twiss parameters, and dispersions at the ImpactX diagnostic locations.
Run the three-code comparison
Open the Tutorial 2 analysis notebook from the same directory and run its cells in order. The notebook performs the following steps:
- CPyMAD loads
fccee_z.madx, selects thefccee_p_ringsequence, defines a 45.6 GeV electron reference beam, and runs MAD-XTWISS. - If
fccee_p_ring.jsonis absent, Xsuite constructs a thick-elementLinefrom that in-memory MAD-X sequence and saves it. Otherwise, it loads the existing line. It then runs a four-dimensional Twiss calculation. - Pandas reads the ImpactX reduced diagnostic, and the notebook maps
the common quantity names—for example, MAD-X
betx, ImpactXbeta_x, and Xsuitebetx—onto the same plot. - The beta functions are compared over the full 90.6 km ring and over the first 2 km, where individual optics features are easier to inspect.
For a beam matrix transported by a linear map \(R(s)\),
\[ \Sigma(s)=R(s)\Sigma(0)R(s)^{\mathsf T}, \qquad \beta_u(s)=\frac{\Sigma_{uu}(s)}{\varepsilon_u}. \]
This is the quantity produced by the ImpactX envelope calculation and overlaid with the Twiss functions from the other two codes. Because the codes record values at different longitudinal locations, any quantitative comparison would first require an explicit matching or interpolation convention.
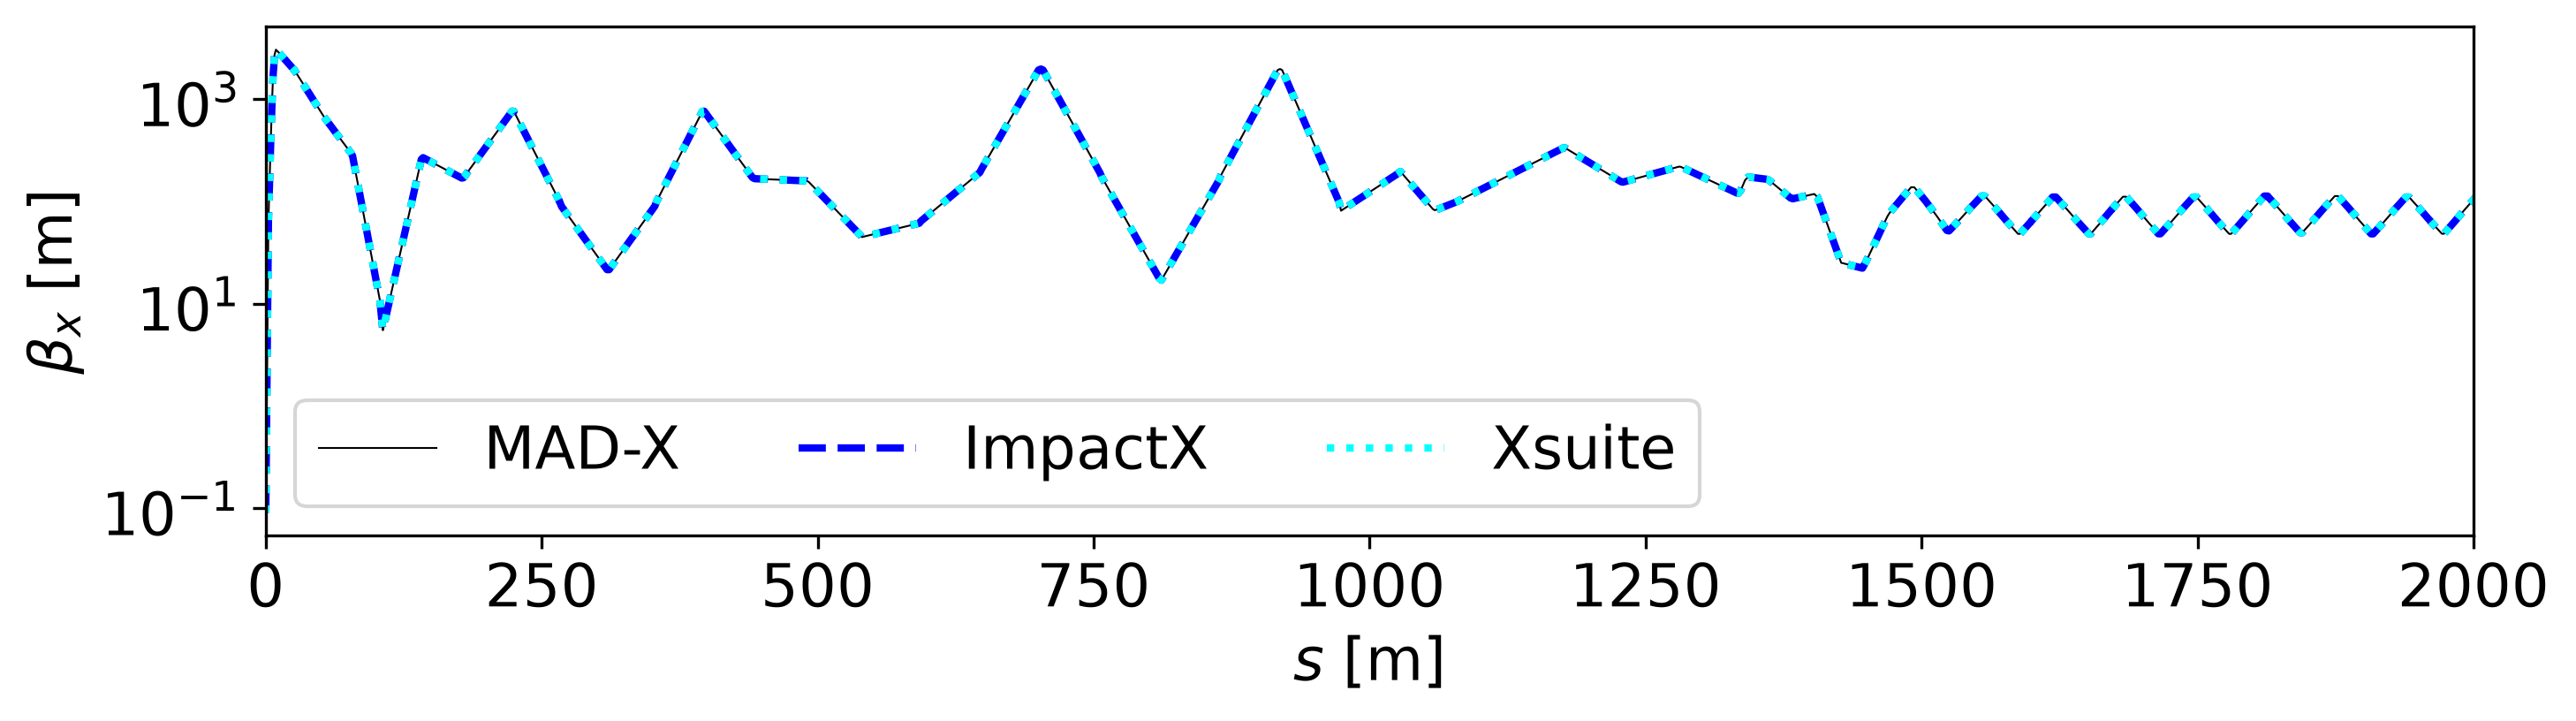
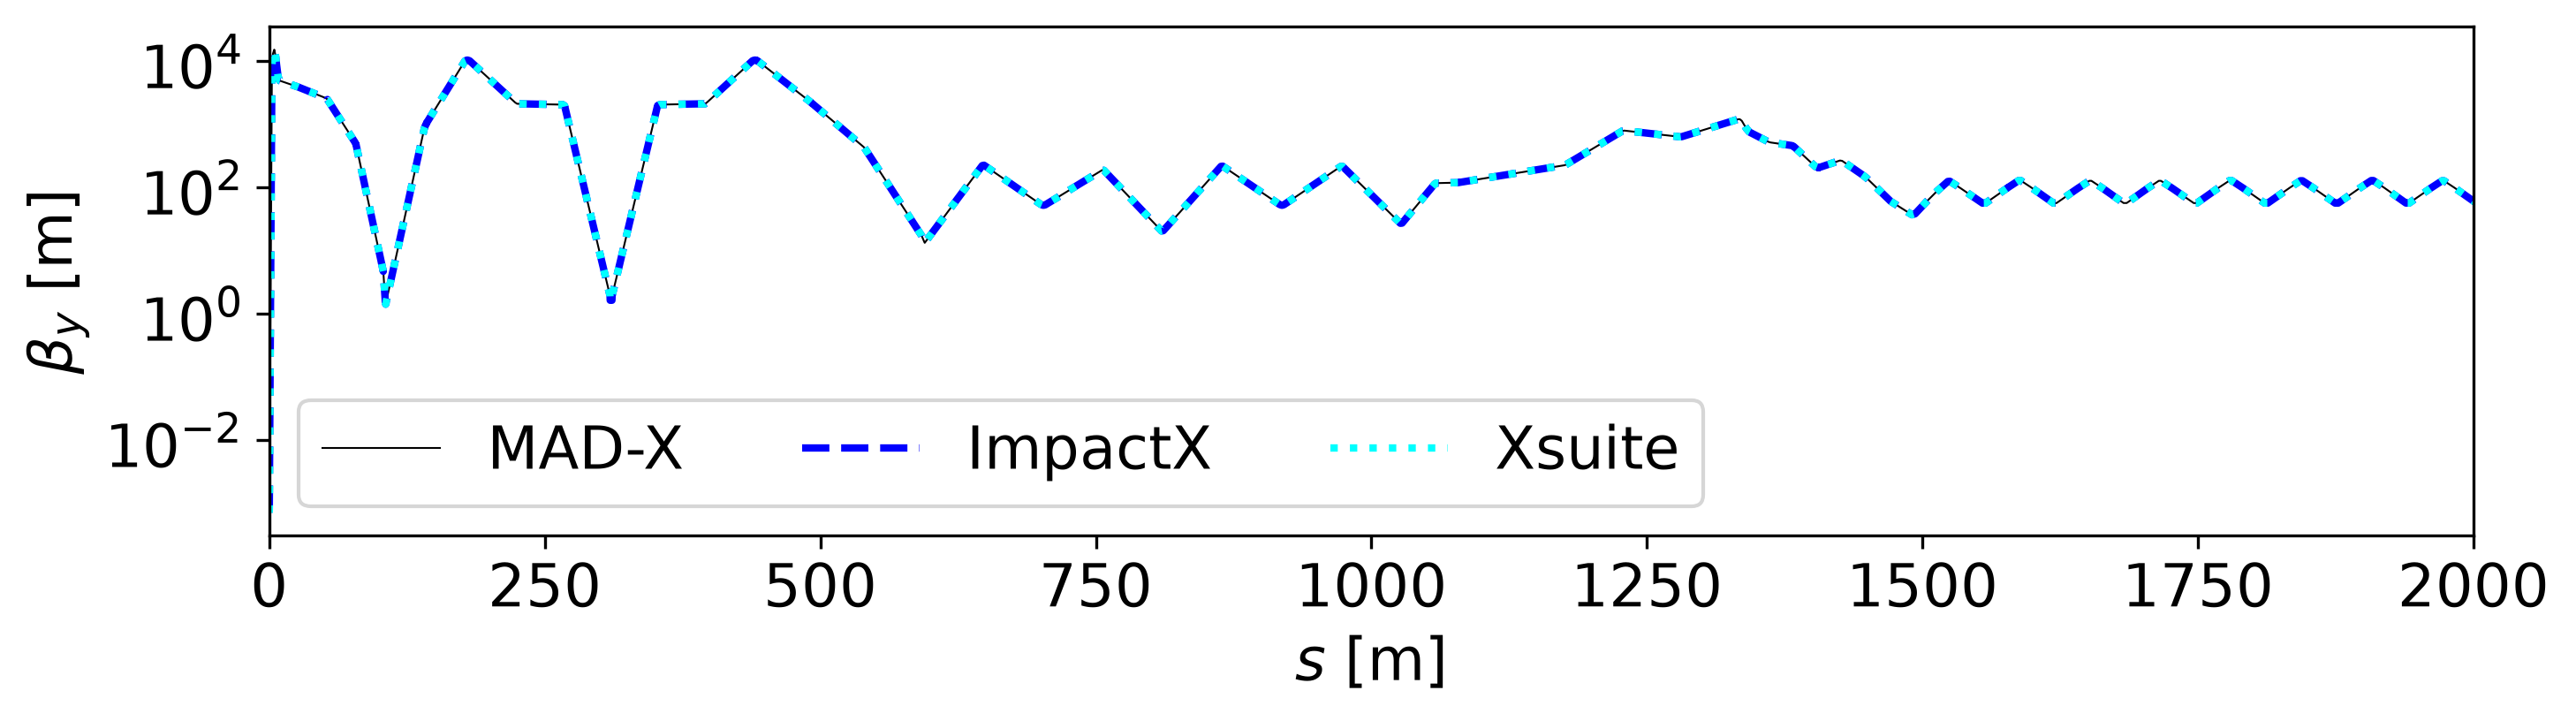
The curves from the tested setup overlap closely in both planes. The final ImpactX beta functions also return to within about 0.1 percent of their initial values after one turn. Inspect the interaction-region peaks and the one-turn closure separately: agreement at low-beta locations is a more sensitive check than agreement in slowly varying sections.
Small differences can come from element slicing, coordinate conventions, or the treatment of fringe fields and higher-order terms. This exercise uses one slice per element and a four-dimensional Xsuite Twiss calculation, so it checks the selected linear model; it does not establish equivalence for nonlinear or synchrotron motion.
Tutorial 3: Multi-turn WarpX and Xsuite simulation
What the coupled model does
This exercise connects two deliberately different descriptions of the collider. Xsuite transports the bunches through a linear map representing one FCC-ee superperiod, while WarpX resolves the collective electron-positron collision at the following interaction point. The same macroparticles are passed back and forth, so the beam-beam kick from one encounter affects every later encounter.
One iteration follows this sequence:
- Xsuite advances both bunches through one linear superperiod.
- The adapter converts the two Xsuite coordinate systems into one laboratory frame and writes one openPMD file per bunch.
- A separate Python process starts WarpX, loads those particles, and advances them through a single head-on collision.
- The adapter combines particles still inside the WarpX box with particles recorded at its absorbing boundaries.
- Particle IDs are matched, the coordinates are converted back, and the Xsuite particle arrays are updated.
- Centroids, rms sizes, covariances, and emittances are recorded before the next iteration.
The separation of responsibilities is important. Xsuite does not apply a second beam-beam kick, and WarpX does not model the 90.6 km arc.
Download the files
Create a Tutorial 3 directory containing:
- Coupled simulation driver
- WarpX input template
- Single-collision WarpX launcher
- Beam and map configuration
- Coupling and analysis utilities
- Analysis notebook
Keep the six files together. The driver renders a run-specific WarpX input in the job directory; it never edits the downloaded template.
Before running the coupling
Tutorial 3 needs numpy, scipy,
pandas, matplotlib, xobjects,
xpart, xtrack, openpmd-api,
openpmd-viewer, and a Python WarpX build with openPMD, FFT,
and QED support. The QED capability is only exercised by the
--beamstrahlung case, but the supplied input declares the
photon product species and quantum-synchrotron table.
Run the driver from the directory containing the six downloaded files. You can inspect all command-line options with
The --device gpu option selects an Xsuite
ContextCupy; WarpX itself uses the backend of the installed
WarpX package. The default direct launcher and one rank are intentional.
The current adapter can only audit its fallback particle-ID mapping in a
single-rank collision.
Simplified FCC-ee model
The reference momentum is 182.5 GeV/\(c\), corresponding to the FCC-ee ttbar working point. For an IP with \(alpha=0\), the initialized Gaussian widths are
\[ \sigma_x=\sqrt{\varepsilon_x\beta_x}, \qquad \sigma_{p_x}=\sqrt{\frac{\varepsilon_x}{\beta_x}}, \]
and likewise in \(y\). The exercise sets \(\varepsilon_x=\varepsilon_y=1.59\,\mathrm{nm}\) and \(\beta_x=\beta_y=1\,\mathrm{m}\), producing round \(39.9\,\mu\mathrm{m}\) beams. This is a teaching configuration, not the nominal flat FCC-ee beam.
The full ring is divided into four identical superperiods. The transverse phase advance used by each Xsuite map is therefore
\[ Q_{x,\mathrm{sp}} =\operatorname{frac}\!\left(\frac{398.148}{4}\right)=0.537, \]
with the same intentionally symmetric value in \(y\). The longitudinal tune is \(Q_{s,\mathrm{sp}}=0.091/4=0.02275\).
Consequently, the command-line --iterations value counts
superperiods: 20 iterations represent five full revolutions, not 20
revolutions.
The Xsuite element explicitly selects
longitudinal_mode="linear_fixed_qs". This matters because
qs and bets are parameters of that particular
LineSegmentMap mode; leaving the mode implicit makes the
intended synchrotron rotation dependent on constructor behavior.
Synchrotron radiation in the arc, the crossing angle, crab-waist sextupoles, and the nonlinear lattice are omitted. Beamstrahlung in WarpX is optional so that its longitudinal effect can be isolated.
The initialized values \(\sigma_z=2.17\) mm and \(\sigma_\delta=1.92\times10^{-3}\) are the beamstrahlung-broadened values retained from the original example. They describe an equilibrium only when the competing ring processes are also modeled. Turning on a fresh beamstrahlung kick at every IP while omitting arc damping, quantum excitation, and synchronous-energy compensation does not preserve that equilibrium; this tutorial should therefore be read as a transient coupling study.
The coordinate handoff
This is the numerically delicate part of the exercise. Xsuite stores
\[ p_x=\frac{P_x}{P_0},\qquad p_y=\frac{P_y}{P_0},\qquad \delta=\frac{P-P_0}{P_0}. \]
Therefore \(p_x\) is not exactly the geometric slope. At a field-free handoff plane,
\[ \frac{P_s}{P_0} =\sqrt{(1+\delta)^2-p_x^2-p_y^2}, \qquad x'=\frac{P_x}{P_s} =\frac{p_x}{\sqrt{(1+\delta)^2-p_x^2-p_y^2}}. \]
Using \(p_x\) directly as \(x'\) introduces an energy-dependent drift error. It can be almost invisible without radiation and then become correlated with beamstrahlung energy loss.
WarpX stores normalized mechanical momenta \(\boldsymbol{u}=\boldsymbol{P}/(m_ec)\). With \((\beta\gamma)_0=P_0/(m_ec)\), the forward conversion is
\[ u_x=(\beta\gamma)_0p_x, \qquad u_y=(\beta\gamma)_0p_y, \qquad u_s=(\beta\gamma)_0 \sqrt{(1+\delta)^2-p_x^2-p_y^2}. \]
After WarpX, the relative momentum deviation must be reconstructed from the full momentum magnitude,
\[ \delta =\frac{\sqrt{u_x^2+u_y^2+u_s^2}}{(\beta\gamma)_0}-1, \]
not from \(u_s\) alone. The polished adapter uses these relations in both directions and tests an algebraic round trip before every collision. Its openPMD writer also attaches the required SI dimensions and unit scales to the position and momentum records; a bare array plus a momentum scale is not a complete external-particle description.
Xsuite defines the longitudinal coordinate as \(\zeta=s-\beta_0ct\). There is consequently a distinction between Xsuite’s coordinates on the IP plane and the simultaneous particle snapshot required by WarpX. At the initial common time \(t_-=-f/(\beta_0c)\), the local longitudinal position is
\[ s_- = \frac{u_s}{\gamma\beta_0}(\zeta-f), \]
and the transverse positions are drifted by \(x_-=x+s_-u_x/u_s\) and \(y_-=y+s_-u_y/u_s\). At the final common time \(t_+=f/(\beta_0c)\), the inverse longitudinal transformation is
\[ \zeta=\frac{\beta_0\gamma}{u_s}s_+-f. \]
The earlier script implicitly replaced the particle velocity \(cu_s/\gamma\) by \(\beta_0c\). That is an excellent numerical approximation for the reference particle at 182.5 GeV, but it is unnecessary and ceases to be an exact round trip after radiation changes the momentum.
The WarpX bunch centers start a distance \(f=4\sigma_z\) before the IP and end the same distance after it, so the collision duration is
\[ T=\frac{2f}{\beta_0c}. \]
Beam 2 requires additional sign changes because its local \(s\) and \(x\) axes point opposite to those of beam 1. The present adapter explicitly rejects a nonzero crossing angle: supporting one correctly would require a consistent transformation of positions, momenta, and time, rather than rotating positions alone.
Run the reference and coupled cases
Run the cases below separately. Giving them the same initial seed makes their initial bunches identical, while the driver assigns a new deterministic WarpX seed to each collision.
| Case | Important option | Output directory | Purpose |
|---|---|---|---|
| Xsuite arc only | --no-warpx |
outputs_without_warpx |
Verify the linear map and unperturbed tunes |
| Classical collision | none | outputs_with_warpx |
Test the coordinate handoff and collective beam-beam kick |
| Collision with beamstrahlung | --beamstrahlung |
outputs_with_warpx_beamstrahlung |
Add stochastic photon emission and longitudinal energy loss |
Choose the run scale according to the question being asked:
| Run level | Macroparticles | Superperiods | Purpose |
|---|---|---|---|
| Smoke test | 1,000 | 1 | Verify installation and one Xsuite–WarpX handoff |
| Tutorial | 10,000 | 20 coupled; 256 arc-only | Inspect moments and coupling checks; obtain a modest-resolution reference FFT |
| High-statistics spectrum | 1,000,000 | 1,024 | Resolve coherent peaks with lower centroid noise on an appropriate GPU or HPC system |
The smoke test is:
It establishes that the workflow runs, but one sample cannot say anything about tunes or coherent modes. For the tutorial-scale analysis, first generate the inexpensive arc-only reference:
Then run the classical WarpX collision. A short laptop test is:
It writes outputs_with_warpx. To test the longitudinal
coupling with quantum-synchrotron emission enabled, use:
The 20-superperiod coupled runs are intended to expose handoff or gross beam dynamics problems; their Fourier-bin spacing is \(1/20=0.05\), which is too coarse for a meaningful coherent tune measurement. The 256-superperiod arc-only run has a finer spacing of about \(0.0039\). A spectrum-quality coupled comparison should use hundreds to 1024 superperiods and enough macroparticles to suppress centroid noise.
That run writes outputs_with_warpx_beamstrahlung. Each
collision starts a new WarpX process because a WarpX simulation cannot
simply be reinitialized in the same Python process. The driver uses a
different deterministic random seed for every collision. Reusing the
same WarpX seed at every iteration would repeat the same Monte Carlo
stream and could turn stochastic photon emission into an artificial
coherent excitation.
The openPMD handoff deliberately does not write
opticalDepthQSR. This is a WarpX QED runtime attribute that
WarpX initializes stochastically for the imported electron and positron
species. The previous openPMD file contained a zero-valued record, but
the documented external_file interface does not include
this runtime attribute and current WarpX initializes it separately. That
record was therefore probably ignored or overwritten, so it is not an
established cause of the observed oscillation. If a version did honor
the supplied value, zero would mean that the sampled emission threshold
had already been reached, rather than “no accumulated probability.”
The default direct launcher is appropriate for the
single-rank Conda WarpX package. --launcher srun is
available for an appropriately compiled HPC installation, but this
teaching adapter currently enforces one WarpX rank so that its fallback
particle-ID mapping remains auditable.
The run-specific working files are placed under
--job-dir, which defaults to the current directory:
| Path | Contents |
|---|---|
outputs_*/moments_b1.csv,
moments_b2.csv
|
One row of bunch moments after each superperiod and collision |
outputs_*/handoff_checks.csv |
Before/after WarpX comparisons for every primary particle |
warpx_read/beam1.bp,
beam2.bp
|
Simultaneous openPMD snapshots written by the adapter |
warpx_runtime_input.txt |
Rendered input used for the most recent collision |
warpx_used_inputs_tutorial_3.txt |
Parameters reported by WarpX for the most recent collision |
warpx_dump/diags |
Primary particles from the most recent WarpX call |
By default the previous collision diagnostic is removed before the
next call. Use --keep-diags only when the individual
openPMD outputs are needed; it can consume substantial storage in a long
run.
Optional high-statistics reference data
Generated 1-million-macroparticle, 1024-superperiod results do not
belong in the lesson’s Git history. The reference-data
instructions define the external archive layout, commands, and
provenance information. If an archive is extracted as
tutorial_3/reference_data/, the notebook detects its
outputs_* directories automatically and plots them
alongside any local runs.
Only the compact moment CSV files and handoff checks should be
published in the archive. Per-collision openPMD files are large and are
unnecessary for the notebook. The older coords_b*.txt
results supplied with the previous adapter use a different schema and
should not be represented as reference results from the revised
coordinate handoff.
Coupling checks
Every coupled run writes handoff_checks.csv. For each
bunch and collision it records:
- the numbers of primary particles sent to and recovered from WarpX
- whether WarpX preserved the supplied IDs or the documented single-rank input-order fallback was needed
- the maximum algebraic position and momentum round-trip error
- \(\langle\zeta\rangle\), \(\sigma_z\), \(\langle\delta\rangle\), and \(\sigma_\delta\) immediately before and after WarpX
- the longitudinal rms emittance before and after WarpX
- the mean energy change and rms instantaneous change in \(\zeta\)
The longitudinal rms emittance is
\[ \varepsilon_\zeta =\sqrt{ \sigma_\zeta^2\sigma_\delta^2 -\operatorname{Cov}(\zeta,\delta)^2 }. \]
These quantities separate a handoff error from longitudinal dynamics. With beamstrahlung off, the algebraic round-trip errors should be near floating point precision, and every primary should be recovered from either the full or boundary diagnostic. With beamstrahlung on, \(\langle\Delta\delta\rangle<0\) and an increase in energy spread are expected; a large instantaneous \(\zeta\) jump during the short WarpX call is more suspicious.
The three runs should have distinguishable signatures:
- In the arc-only run, a distribution matched to
betsshould preserve its longitudinal rms emittance and approximately preserve \(\sigma_z\) and \(\sigma_\delta\). Its centroid spectrum locates the unperturbed map tune. - In the classical WarpX run, the transverse moments and coherent spectrum can change, but there should be no systematic radiative decrease in \(\langle\delta\rangle\). This is the most sensitive end-to-end handoff test.
- In the beamstrahlung run, the collision should first change \(\langle\delta\rangle\), \(\sigma_\delta\), and possibly \(\varepsilon_\zeta\). A later change in \(\sigma_z\) during Xsuite transport is the expected response of a longitudinally mismatched bunch.
If a run does not follow this pattern, use the following checks before interpreting the physics:
- Confirm that
n_returned == n_sentfor both beams. A difference means that the final and boundary diagnostics did not recover every primary. - Inspect both algebraic round-trip errors. They test the adapter itself and should not depend on whether beamstrahlung is enabled.
- Compare
zeta_std_before_mandzeta_std_after_m. A large change here occurs inside the WarpX call; a change only in the following row occurs in the Xsuite arc. - Compare runs with different
--seedvalues. A feature that changes phase or disappears can be a finite-macroparticle or Monte Carlo fluctuation. - Repeat with more longitudinal cells and macroparticles before drawing a quantitative conclusion from the size of the effect.
Why beamstrahlung can produce a real bunch-length oscillation
Even a perfect handoff does not imply constant \(\sigma_z\). Beamstrahlung changes the momentum distribution locally at the IP but does not simultaneously rematch the bunch length and \(\zeta\)-\(\delta\) covariance. The next linear synchrotron map transports the covariance as
\[ \Sigma_s(n+1)=R_s\Sigma_s(n)R_s^{\mathsf T}. \]
For the usual phase-space rotation, the new bunch-length variance contains contributions from both the old bunch length and energy spread,
\[ \sigma_{\zeta,n+1}^2 =\cos^2\mu_s\,\sigma_{\zeta,n}^2 +\beta_s^2\sin^2\mu_s\,\sigma_{\delta,n}^2 +2\beta_s\sin\mu_s\cos\mu_s \operatorname{Cov}(\zeta,\delta), \]
up to the sign convention of the longitudinal map. Thus a beamstrahlung increase in \(\sigma_\delta\) naturally becomes an oscillation of \(\sigma_z\). In this simplified model there is no radiation damping, quantum excitation, consistent compensation of the mean radiative loss, or self-consistent beamstrahlung equilibrium to damp or rematch that oscillation.
The most useful diagnostic sequence is:
- Check whether \(\sigma_z\) jumps across the WarpX call itself.
- Check whether beamstrahlung first changes \(\sigma_\delta\) and \(\varepsilon_\zeta\).
- Check whether \(\sigma_z\) changes mainly after the next Xsuite arc map.
- Repeat with several initial seeds to rule out a correlated Monte Carlo excitation.
Analyze the coherent modes
Open the Tutorial 3 notebook and run its cells after producing one or more output directories. It plots the beam moments, the handoff checks, and windowed centroid spectra.
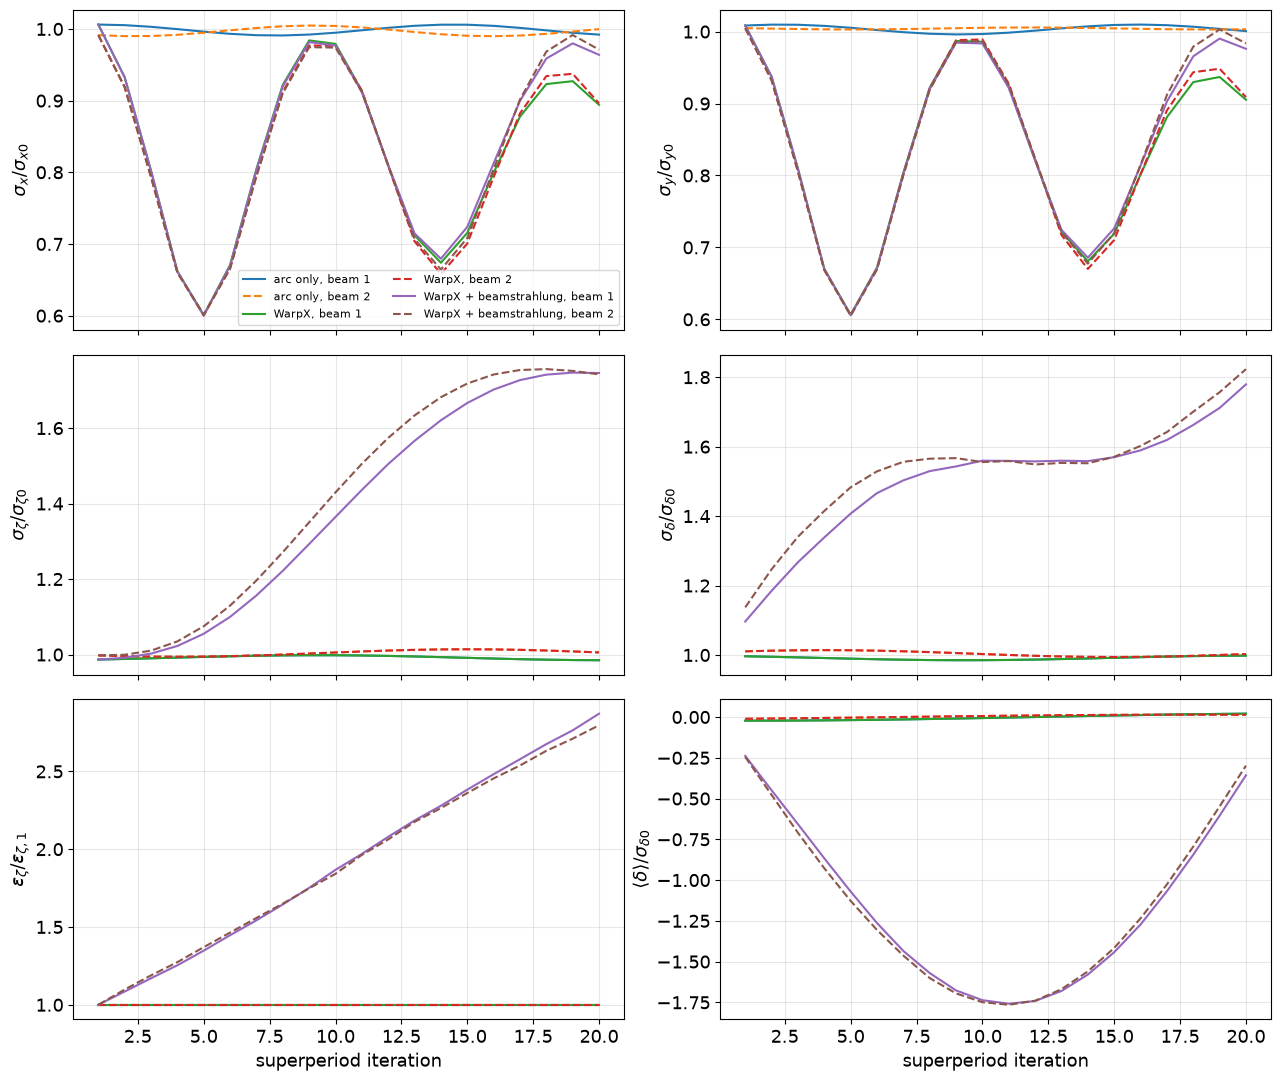
The following diagram illustrates the physical transverse displacement of the two beams at successive collision samples. In the \(\sigma\) mode the beams move together, whereas in the \(\pi\) mode they move oppositely. The diagram’s “Turn” labels are schematic: this tutorial records one superperiod and one IP encounter per sample, so four samples correspond to one full-ring turn.
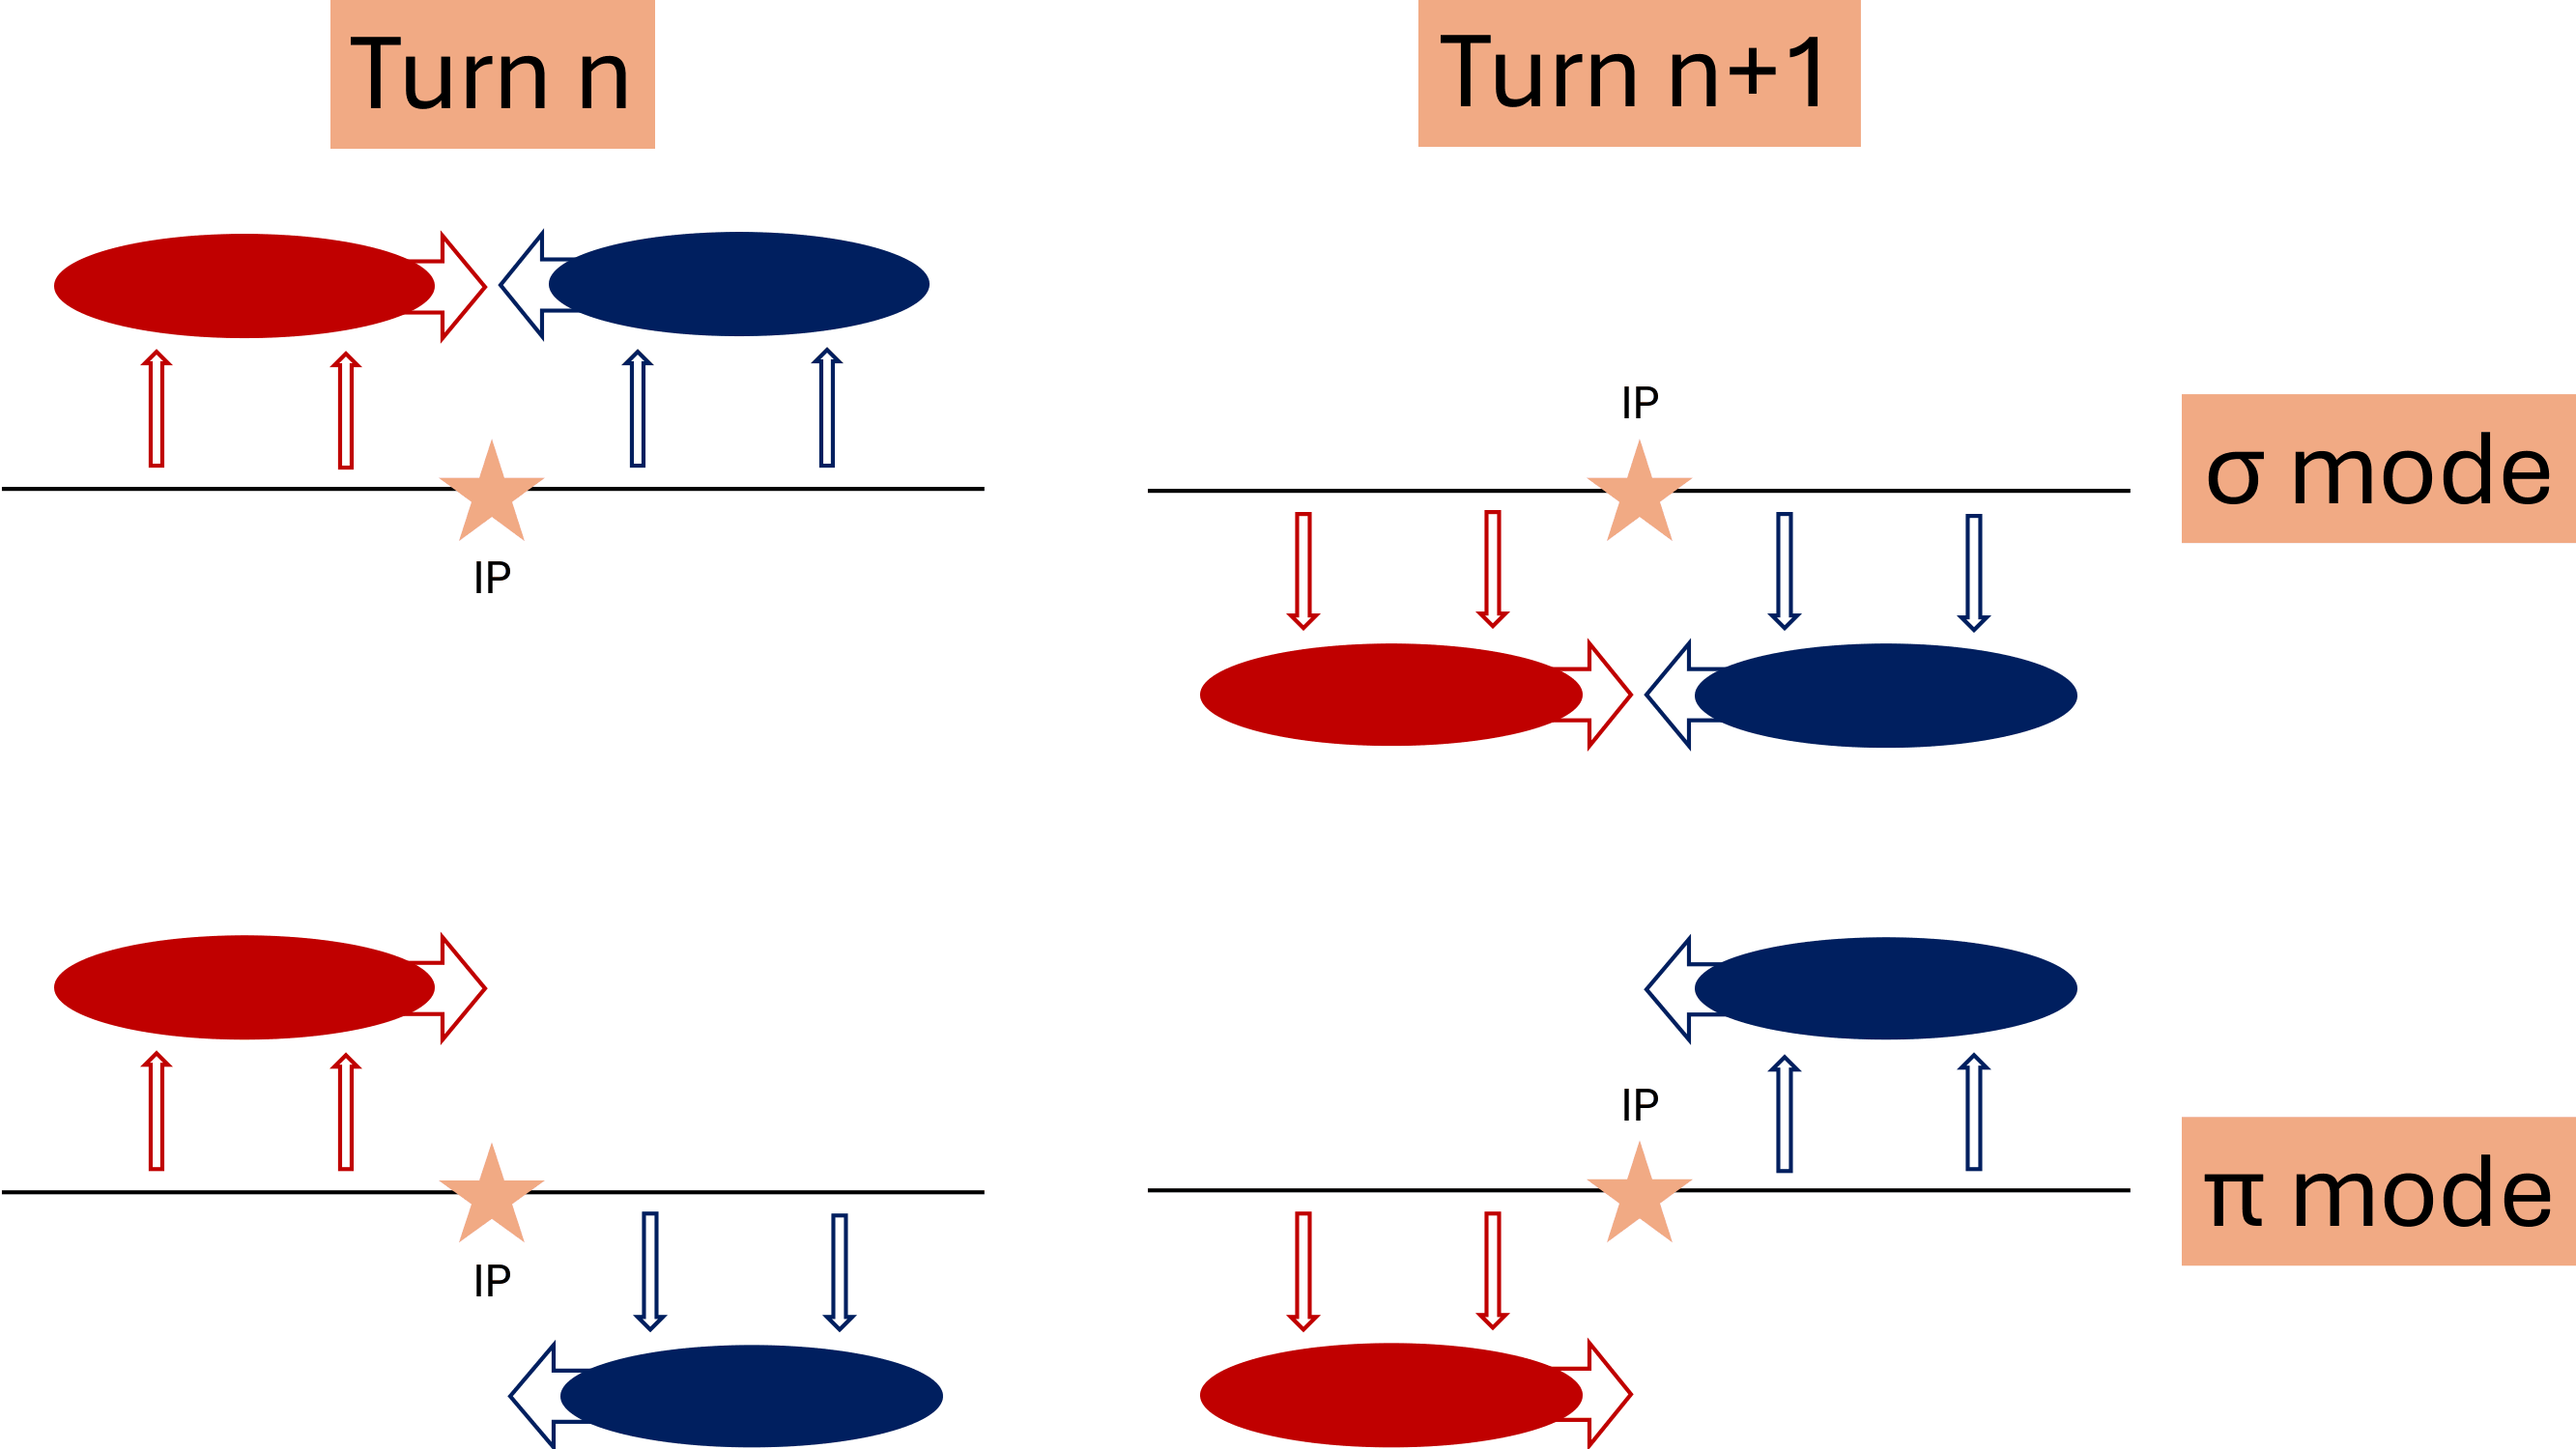
Without beam-beam interaction, the centroid has one peak at the unperturbed superperiod tune. Two identical interacting beams instead have two coherent normal modes:
- the \(\sigma\) mode, in which the physical beam centroids move in phase and \(Q_\sigma\simeq Q_0\)
- the \(\pi\) mode, in which their physical centroids move oppositely and the beam-beam force shifts the coherent tune
Because the local horizontal axes point in opposite directions,
\[ x_\sigma=x_1-x_2, \qquad x_\pi=x_1+x_2. \]
The vertical axes have the same orientation, so \(y_\sigma=y_1+y_2\) and \(y_\pi=y_1-y_2\). For \(N\) recorded superperiods, the FFT bin spacing is \(\Delta Q=1/N\). Twenty iterations are useful for checking the workflow but are too short for a clean mode measurement; use hundreds of iterations for the spectrum.
This adapter assumes head-on beams, field-free handoff planes, ultra-relativistic primary particles that all appear in either the final or boundary diagnostic, and a single WarpX rank. Boundary-scraped particles are propagated ballistically to the common final time. These assumptions are checked or stated explicitly, but they remain part of the model.
- WarpX resolves one collision in detail and writes both particle snapshots and collider-specific reduced diagnostics.
- The laptop input prioritizes runtime and teaching value over numerical convergence.
- Matching particle IDs between diagnostics makes the normalized kick slope a direct check of the linear beam-beam model.
- Keeping different QED products in separate species makes their spectra and weighted yields easier to inspect.
- The luminosity, Bhabha cross-section, lifetime, and pair-distribution checks connect the openPMD and reduced diagnostics to accelerator observables.
- Using one MAD-X sequence and one matched covariance model makes the Tutorial 2 beta-function comparison sensitive to differences in lattice translation and linear transport.
- The Tutorial 3 adapter converts normalized momentum and geometric slope separately; this prevents beamstrahlung energy loss from contaminating the transverse drift.
- A beamstrahlung-induced \(\sigma_z\) oscillation is not automatically a coupling error: a local increase in energy spread creates a longitudinal mismatch that the arc map rotates into bunch length.
- Per-collision handoff logs distinguish an instantaneous coordinate jump from subsequent synchrotron motion.
Content from LLNL HPC Innovation Center 2026: WarpX/ImpactX Tutorial
Last updated on 2026-09-23 | Edit this page
Estimated time: 180 minutes
Overview
Questions
- 🔬 What are WarpX and ImpactX?
- 🔍 What can they reveal about plasmas and particle beams?
- 🧩 How do numerical details turn into computing work?
- 🚀 How do we launch, measure, and explore a simulation on CPU or GPU?
Objectives
- 💡 Connect each physical system to the numerical model used by the code.
- 🚀 Learn how to run WarpX and ImpactX simulations on CPU and GPU.
- ⏱️ Read simulation logs, extract timing information, and interpret physics diagnostics.
- 📊 Visualize plasma dynamics and beam transport using saved diagnostics.
- 🔍 Measure what changes when using different numerical parameters.
Your route through the tutorial 🗺️
Today we will make electron streams form an instability, launch a laser into a plasma, and send a beam through magnets. Along the way, keep an eye on what the computer is doing: how long it takes, which hardware is working, and how much data it saves. 🔬 💻
Refer to the introduction to WarpX for the particle-in-cell (PIC) method and the physical questions WarpX can help answer. Refer to the introduction to ImpactX for beam dynamics, accelerator elements, and the questions ImpactX can help answer. These pages provide the background and remain available after the workshop.
Our three stops connect the physics to the computing:
| Exercise | Physical system | Numerical model | Computing activity |
|---|---|---|---|
| 🎢 Two-stream instability | Two counter-streaming electron populations | 1D grid with computational particles | Practice running WarpX, reading its log, and plotting output |
| 🏄 Laser wakefield | A laser and plasma interacting | 3D grid with computational particles | Run on CPU and GPU; connect grid size, time steps, and diagnostics to cost |
| 🧲 Beam transport | A bunch of electrons tracked through a sequence of magnets | Computational particles | Practice running ImpactX; compare beam plots |
Meet your remote machine 💻
Registered participants receive an AWS-hosted JupyterLab link through Slack. Open that link to access it. Your remote instance runs a Docker container with the software and tutorial files already installed. Your browser is the interface: the simulation and its files live on the remote machine.
Start by finding out where you landed. Open File > New > Terminal in JupyterLab and run:
BASH
pwd             # show the working directory
ls              # list the files in the current directory
lscpu           # show CPU specs
nvidia-smi      # show NVIDIA GPU and its memory
which python    # show the active Python executable
which warpx.1d  # see if and where the 1D executable is
which warpx.3d  # see if and where the 3D executable is
🎬 As a first step, prepare your working copies:
The script copies the necessary files into the workshop folders. Existing files are left untouched; rerunning only fills in missing files.
📝 Keep a small run record as you go: hardware, input settings, elapsed time, output size, and one observation from the plots. Those notes will help you explain differences between runs.
The hosted image provides two Python environments:
| Where you work | CPU (default) | GPU |
|---|---|---|
| Jupyter notebook: Kernel > Change Kernel |
WarpX CPU | WarpX GPU |
| Terminal activation command | source /opt/venv-cpu/bin/activate |
source /opt/venv-gpu/bin/activate |
💡 Two places to choose your environment: both environments include ImpactX as well as WarpX. Selecting a notebook kernel does not change the environment in an already open terminal.
Keep your previous results
WarpX writes the requested diagnostics to a diags/
folder and reuses it when rerun. Before repeating a run, copy the input
file and Python driver into a separate run folder and rerun there. This
keeps the input settings with each result. The ImpactX notebook already
creates a separate folder for each run.
Joining from your own machine? 🏠
To run the tutorial on your own machine, follow the Docker or Conda setup instructions. Choose one of these two options:
- Docker: run the provided image, which includes the software and tutorial files. See the container documentation for GPU access or instructions to build the image yourself.
-
Conda: download the complete tutorial folder and
create an environment using its
environment_setup.ymlfile, as described in the setup instructions. Keep the scripts, inputs, and notebooks together.
The /opt/venv-* activation commands above apply to the
hosted instance and the provided Docker image. With Conda, use
conda activate llnlhpc26-warpx-tutorial instead.
Exercise 1: induce a famous plasma instability
🎢 Start with two electron populations moving in opposite directions at one tenth of the speed of light. Small density variations create an electric field, which influences the electron motion and can make those variations grow. This feedback is the two-stream instability. Eventually particles become trapped in the wave and the rapid growth saturates.
WarpX simulates this motion along one spatial direction, z, on a periodic grid: particles leaving one end re-enter at the other. A stationary positive background is assumed; ions are not tracked explicitly. This small example introduces the PIC particle–field update cycle.
Launch your first run 🚀
In a terminal with the CPU environment active, start from the
llnl-hpc-2026 tutorial directory:
BASH
cd two_stream_instability
ls
export OMP_NUM_THREADS=2  # one thread per physical core (4 vCPUs = 2 cores)
You can launch the same simulation using either the Python
script or the warpx.1d executable. Both read the same
input
file. Choose one of the commands below for your
first run.
BASH
# Option 1: Python
python run_two_stream_instability.py

# Option 2: WarpX executable
warpx.1d two_stream_instability_input.txt
Wait for the simulation to finish. Check the output for errors and find the TinyProfiler total time near the end. Then check the disk space used by the diagnostics:
Record the TinyProfiler total time and output size.
To include Python startup in the timing, launch your run with:
The real value in the terminal is the elapsed wall-clock time.
To save standard output and errors to run.log, choose
one command:
BASH
# Option 1: Python
python run_two_stream_instability.py > run.log 2>&1

# Option 2: WarpX executable
warpx.1d two_stream_instability_input.txt > run.log 2>&1
> run.log 2>&1 sends both to the file,
overwriting any existing log.
Peek under the hood 🔧
Open the input file in JupyterLab’s editor and find the settings below. You do not need to decipher every line: first locate the grid, particles, and output controls. Keep their values unchanged for this run.
| Setting | Meaning in this run |
|---|---|
geometry.dims = 1 |
Fields vary along one spatial direction |
my_constants.nx = 256 |
The domain has 256 grid cells |
ele1.num_particles_per_cell = 200 and the equivalent
ele2 setting |
Each cell initially samples each electron population with 200 macroparticles |
stop_time = T |
End at the specified physical simulation time |
particles.intervals |
How often particle snapshots are written |
my_constants.cfl = 0.9 |
Time step as a fraction of the CFL limit |
This input describes 256 × 200 × 2 = 102,400 macroparticles. They represent many more physical electrons, depending on the value of the density. At each step, WarpX updates particle motion and fields and, when requested, writes a snapshot.
For this 1D setup, the time step is \(\Delta t = \mathrm{cfl}\,\Delta z/c\).
Spot the instability 📈
Open two_stream_instability_plots.ipynb
from the two_stream_instability folder and select
WarpX CPU. Run its cells after the simulation finishes.
The notebook displays the final phase-space snapshot and the
field-energy history.
A phase-space plot shows position on one axis and momentum on the other. Here they are \(z\) and \(p_z/(m_ec)\), the longitudinal momentum divided by the electron mass and the speed of light. Plot other phase-space snapshots to see the evolution of the two populations. Initially, they are separate streams. How do they evolve?
The notebook also plots field energy over physical time. Look for the electric field energy to rise and then level off. This time axis describes the plasma’s evolution, not how long the computer ran.
Experiments
Physics
Describe what you see 👀. What evidence of the two-stream instability can you identify in the final phase-space snapshot and the field-energy history?
Computing
Save your baseline results. Change one setting at a time, keeping all others fixed, and rerun the simulation and plotting cells.
- Change
my_constants.nx. How do particle count, number of steps, runtime, and output size change? - Restore the baseline, then change
my_constants.cfl. How do runtime and the plots compare at the same physical time? Can you trust the results just because the run finishes? - Restore the baseline input and compare CPU runs with 1, 2,
and 4 OpenMP threads by setting
export OMP_NUM_THREADS=accordingly. Calculate the speedup as \(T_1/T_N\), where \(T_N\) is the time with \(N\) threads. - Restore the baseline input and run on GPU after
source /opt/venv-gpu/bin/activate. What is the speedup with respect to the CPU runs?
Physical or numerical instability?
The two-stream instability is physical: energy from the electron streams feeds a growing electric field. Numerical instability is artificial growth of numerical errors, for example when the time step exceeds the CFL limit. Growing field energy alone is not enough to distinguish them: perform convergence tests to check whether the behavior persists with a smaller time step and finer grid.
The input file, execution log, output, and analysis notebook make up the four parts of a simulation workflow, and we will use them again in the next exercise.
Exercise 2: accelerate electrons with a laser
🏄 In laser-wakefield acceleration (LWFA), an intense laser pulse pushes plasma electrons aside, leaving a wave behind it. Electrons caught in this wake can gain energy from its electric field. WarpX follows the laser, particles, and fields on a 3D grid. See A Laser Wakefield Accelerator for more details.
This and the next exercise illustrate two stages: accelerating
electrons in plasma and transporting a beam through magnets. The folder
name htu refers to the Hundred-Terawatt
Undulator, a beamline at LBNL’s BELLA Center used in the ImpactX
example. Our small wakefield demonstration runs independently of
that beam-transport example; its output is not passed to ImpactX.
Launch your first run 🔦
Start from the llnl-hpc-2026 tutorial directory. If you
are still in two_stream_instability/, run
cd .. first. The startup script already prepared the
wakefield files; no separate download is needed.
Choose one command. Both use the same input file:
BASH
# Option 1: Python
python run_lwfa_warpx.py

# Option 2: WarpX executable
warpx.3d lwfa_warpx_input.txt
In a second terminal, inspect GPU usage with nvidia-smi
while the run progresses. Once it finishes, check for errors and record
the TinyProfiler total time and output size:
GPU execution requires a GPU-enabled WarpX build. CPU execution is also possible but can take substantially longer.
Peek under the hood 🧩
Find these settings in the input file:
| Setting | Meaning in this run |
|---|---|
my_constants.nx, ny, nz
|
32 × 32 × 512 = 524,288 grid cells |
my_constants.lambda0 |
Laser wavelength: 0.8 µm |
my_constants.a0 |
Laser strength: 3.0 |
warpx.do_moving_window = 1 |
The simulation box follows the laser |
diag1.intervals = 200 |
Save a snapshot every 200 steps |
The box spans 16 × 16 × 20 µm, with about 20 longitudinal cells per laser wavelength. Electrons move while helium ions stay fixed. The default run takes 1,836 steps of approximately 0.129 femtoseconds each.
Find the wake 🏄
Open wakefield.ipynb from
the llnl-hpc-2026/htu/lwfa_warpx folder and select
WarpX GPU. It analyzes the completed run; it does not
launch a simulation or require GPU acceleration.
Use the plot guide to identify the electron-depleted cavity, accelerating field, and electron energy distribution. Explore snapshots during propagation: the final frame is after the moving window has left the plasma.
Experiments
Physics
Describe what you see 👀. Where is the wake relative to the laser? What evidence do you see that electrons gain energy? How does the wake change as it crosses the plasma?
For an optional particle-loading experiment, see regular versus random placement.
Computing
- Change the grid spacing in all three directions, keeping the physical box size and other settings fixed. How do the cell count and workload change?
- Run the same case on CPU. How does the time per step compare with GPU?
On HPC for highly parallel simulations, grid cells are blocked
together for parallel Domain
Decomposition. The example’s inputs set
amr.blocking_factor = 16, thus use multiples of 16 for grid
cells nx, ny, and nz. A smaller
dz also shortens the time step, so the run needs more
steps.
Exercise 3: track an electron beam through a real beamline
🧲 Track an independent electron bunch through the HTU beamline with ImpactX. Read A Beam Transport Line for the initial bunch, magnet sequence, and modeling assumptions. This example uses its own source; it does not read the wakefield output.
Launch your first run 🧲
Open htu_transport.ipynb
from llnl-hpc-2026/htu/beamline_impactx/ in JupyterLab and
select WarpX CPU. This notebook launches the simulation
as well as plotting its results. Keep the default settings and run steps
1–3. Record the reported runtime and output size. Each run gets a new
folder under llnl-hpc-2026/htu/runs/.
Peek under the hood 🧩
Find these settings in the notebook:
| Setting | Meaning in this run |
|---|---|
particles = 10000 |
Number of macroparticles sampling the bunch |
reference_total_energy_MeV = 100.0 |
Reference and bunch total energy, including rest energy, in MeV |
Explore the beam screens 🔍
Run the diagnostic-reading and plotting cells, then use Play screens or the slider to follow the beam. Use the HTU plot guide to connect screen images and rms sizes to the magnets. Turn off Zoom to fit when comparing beam sizes.
Experiments
Physics
Describe what you see 👀. Does the beam stay round? Where is it narrowest in each plane? How do changes in beam size relate to the nearby magnets?
What would happen if you replaced the initial ImpactX bunch with the beam produced by WarpX in Exercise 2? Which beam properties would affect its transport through the same magnets?
Computing
Try increasing particles in the notebook settings,
keeping the other settings fixed, then rerun the simulation and beam
viewer. How does the beam’s sampled shape change? Record the runtime and
output size, without assuming either scales in direct proportion to
particle count.
Switch the notebook kernel to WarpX GPU and rerun. How does the performance differ from CPU?
For an optional physics extension, try the beam-energy experiment.
What changes when the simulation gets larger? 🌍
These examples fit on one machine. A larger plasma, finer grid, or more particles may require more memory or take too long to simulate. On a supercomputer, we can distribute that work across multiple machines (compute nodes) using MPI.
More hardware also means exchanging data between processes and keeping them all busy. The question becomes: how much faster does the same simulation run when we give it more resources? This is a scaling study. Our container has no MPI support, so we have explored workload and CPU/GPU performance here, but not scaling across nodes.
Plan a larger run 💬
Choose one exercise. If you made it much larger, what would become the main limitation: runtime, memory, or output size? Use your measurements to explain your prediction. How would you test whether adding more CPUs or GPUs helps?
Keep exploring: connect the codes 🔗
A larger study can pass a plasma-generated bunch from WarpX to ImpactX. That requires a resolved source, a suitable particle selection, and consistent coordinate conventions. It is outside these exercises: a high-energy tail alone does not establish a usable beam. The two notebooks use independent sources.
- 🧩 Physics and numerical representation determine the workload; hardware determines how that workload is executed.
- 📝 Record the input, hardware, elapsed runtime, and output alongside the plots.
- 💾 More particles, finer grids, and more frequent diagnostics have different scientific benefits and computational costs.
- 🔍 Compare the same problem to measure a hardware speedup; compare physical observables to judge whether a numerical change matters scientifically.